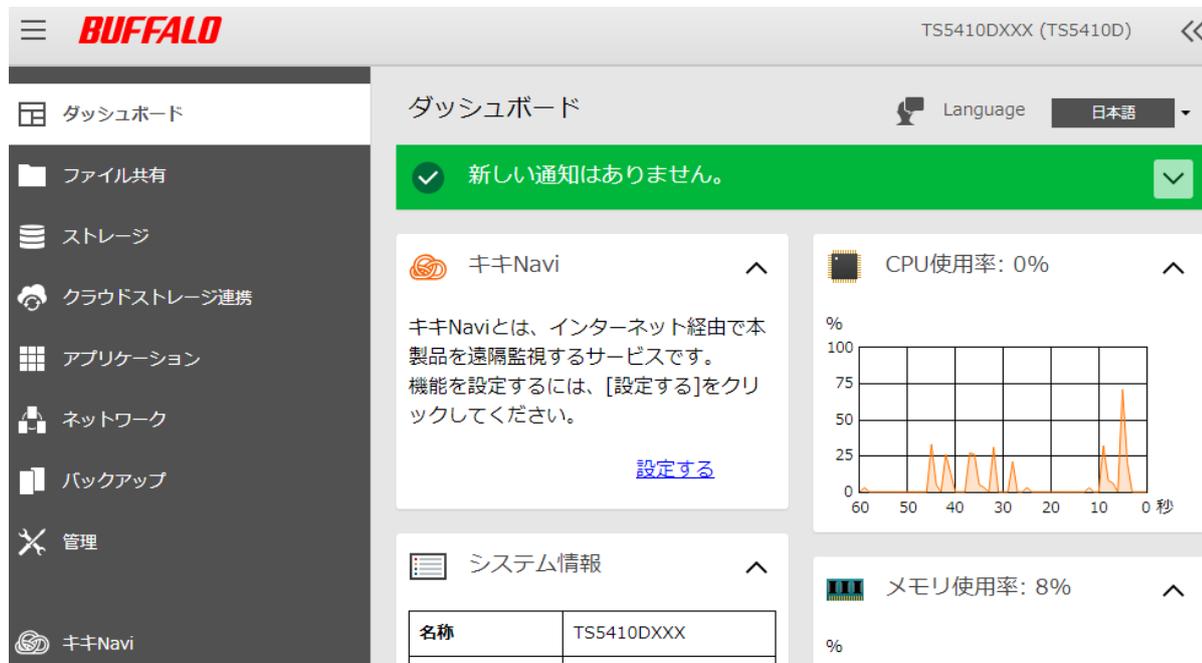
ダッシュボードで情報を確認する
設定画面を表示すると、ダッシュボードが表示されます。ダッシュボードでは、以下の情報が確認できます。
- • エラーなど、発生している通知
- • システム情報(本製品の名称、ファームウェアバージョン、シリアル番号など)
- • ストレージ情報(本製品内蔵のドライブ、LVM、iSCSIの使用容量など)
- • CPU使用率
- • メモリ使用率
- • ネットワーク情報(IPアドレス、MACアドレス、リンク速度など)
Screenshot of the BUFFALO TS5410DXXX (TS5410D) dashboard. The interface shows a sidebar with menu items: ダッシュボード (Dashboard), ファイル共有 (File Sharing), ストレージ (Storage), クラウドストレージ連携 (Cloud Storage Integration), アプリケーション (Applications), ネットワーク (Network), バックアップ (Backup), 管理 (Management), and キキNavi. The main dashboard area includes a green notification bar stating '新しい通知はありません。' (No new notifications). Below are several widgets: 'キキNavi' (KikiNavi) with a description and a '設定する' (Set) button; 'CPU使用率: 0%' (CPU Usage: 0%) with a line graph showing usage over 60 seconds; 'システム情報' (System Information) with a table showing '名称' (Name) as 'TS5410DXXX'; and 'メモリ使用率: 8%' (Memory Usage: 8%) with a bar graph.
メモ:
-
• 本製品に保存しているファイルの数が増加すると、メモリ使用率が上昇することがあります。一定時間経過するとメモリは解放されるためメモリ使用率も自動的に下降します。すぐにメモリを解放するには、以下の操作をお試してください。
- ◦ 本製品を再起動する
- ◦ USBドライブを取り外す
- • ドライブの空き容量が少なくなると、本製品の動作が不安定になることがあります。本製品の空き容量が常に1 GB以上となるように運用してください。