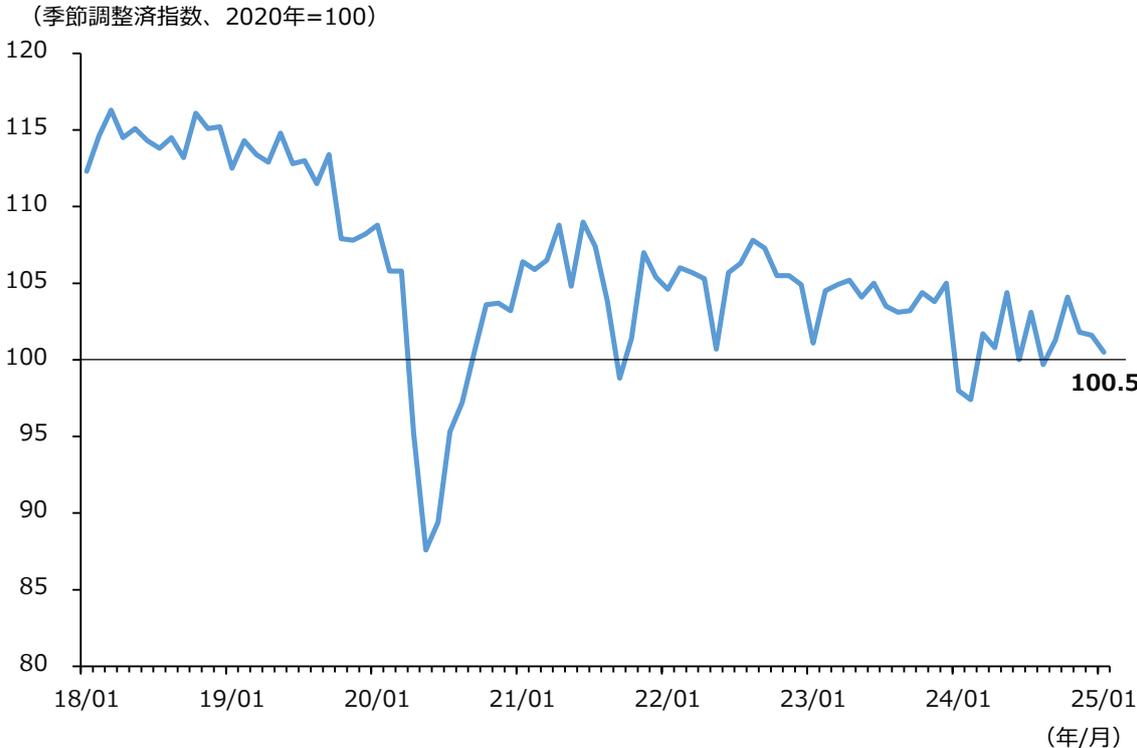
経済産業省「鉱工業生産指数」を用いて、鉱工業の生産活動の状況を見ると、2020年4月には大幅な落ち込みとなった一方で、2020年9月頃
に回復し、足下では緩やかな低下傾向にある(第1-1-2図)。
第1-1-2図 鉱工業生産指数の推移
| 年/月 | 指数 (2020年=100) |
|---|---|
| 18/01 | 112 |
| 19/01 | 114 |
| 20/01 | 108 |
| 20/04 | 87 |
| 21/01 | 106 |
| 21/09 | 109 |
| 22/01 | 105 |
| 23/01 | 105 |
| 24/01 | 97 |
| 25/01 | 100.5 |
Line chart showing the trend of the Industrial Production Index (Seasonally Adjusted, 2020=100) from January 2018 to January 2025. The index starts around 112 in 2018, fluctuates between 110 and 116 until early 2020, then drops sharply to a low of approximately 87 in April 2020. It recovers to about 109 in September 2020, then fluctuates between 100 and 108 until early 2024, when it drops again to around 97. The final value in January 2025 is 100.5.
資料:経済産業省「鉱工業生産指数」
(注) 指数値は、「2025年1月速報」(2025年2月28日公表)による。
第1節
第2節
第3節
第4節
第5節
第6節
第7節
第8節
第9節