第1-1-8図は、景況調査を用いて、業種別に業況判断DIの推移を見たものである。これを見ると、2020年第2四半期にいずれの業種も大きく業況判断が悪化しただが、その後は回復傾向にあった。
た。この傾向は2023年上半年期においては継続していたものの、2024年以降は、いずれの業種も回復に足踏みの傾向が続いている。
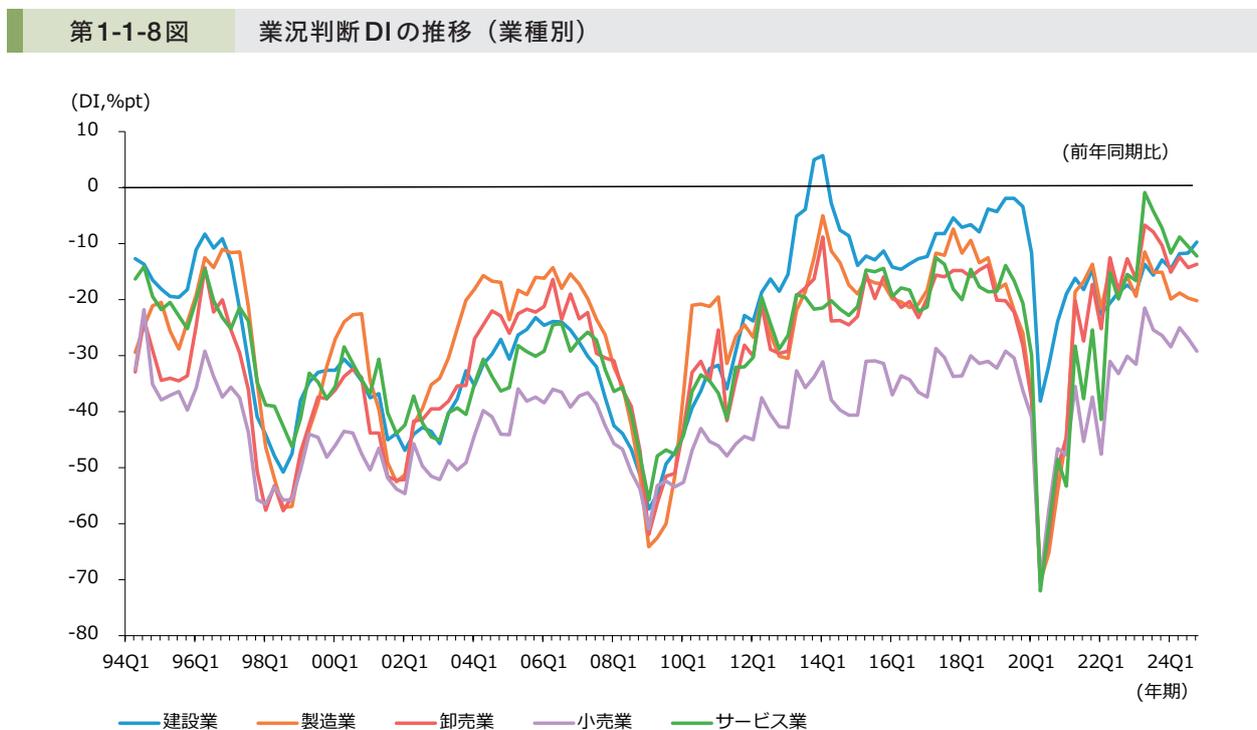
第1-1-8図 業況判断DIの推移(業種別)
(DI, %pt)
(前年同期比)
(年期)
— 建設業 — 製造業 — 卸売業 — 小売業 — サービス業
Line graph showing the Business Condition Index (DI) for five industries from 1994 to 2024. The Y-axis represents the DI in percentage points (DI, %pt) ranging from -80 to 10. The X-axis shows quarters from 94Q1 to 24Q1. A horizontal line at 0 represents the 'Year-on-Year Comparison' (前年同期比). The industries shown are Construction (blue), Manufacturing (orange), Wholesale (red), Small Retail (purple), and Services (green). All industries show a significant dip in 2020Q2, with Services reaching the lowest point at approximately -75%pt. Post-2020, all industries show a recovery trend, though some remain below the zero line.
資料:中小企業庁・(独)中小企業基盤整備機構「中小企業景況調査」
(注)景況調査の業況判断DIは、前年同期と比べて、業況が「好転」と答えた企業の割合(%)から、「悪化」と答えた企業の割合(%)を引いたもの。