第1-1-11図 売上高・経常利益の推移(企業規模別、小規模企業を含む)
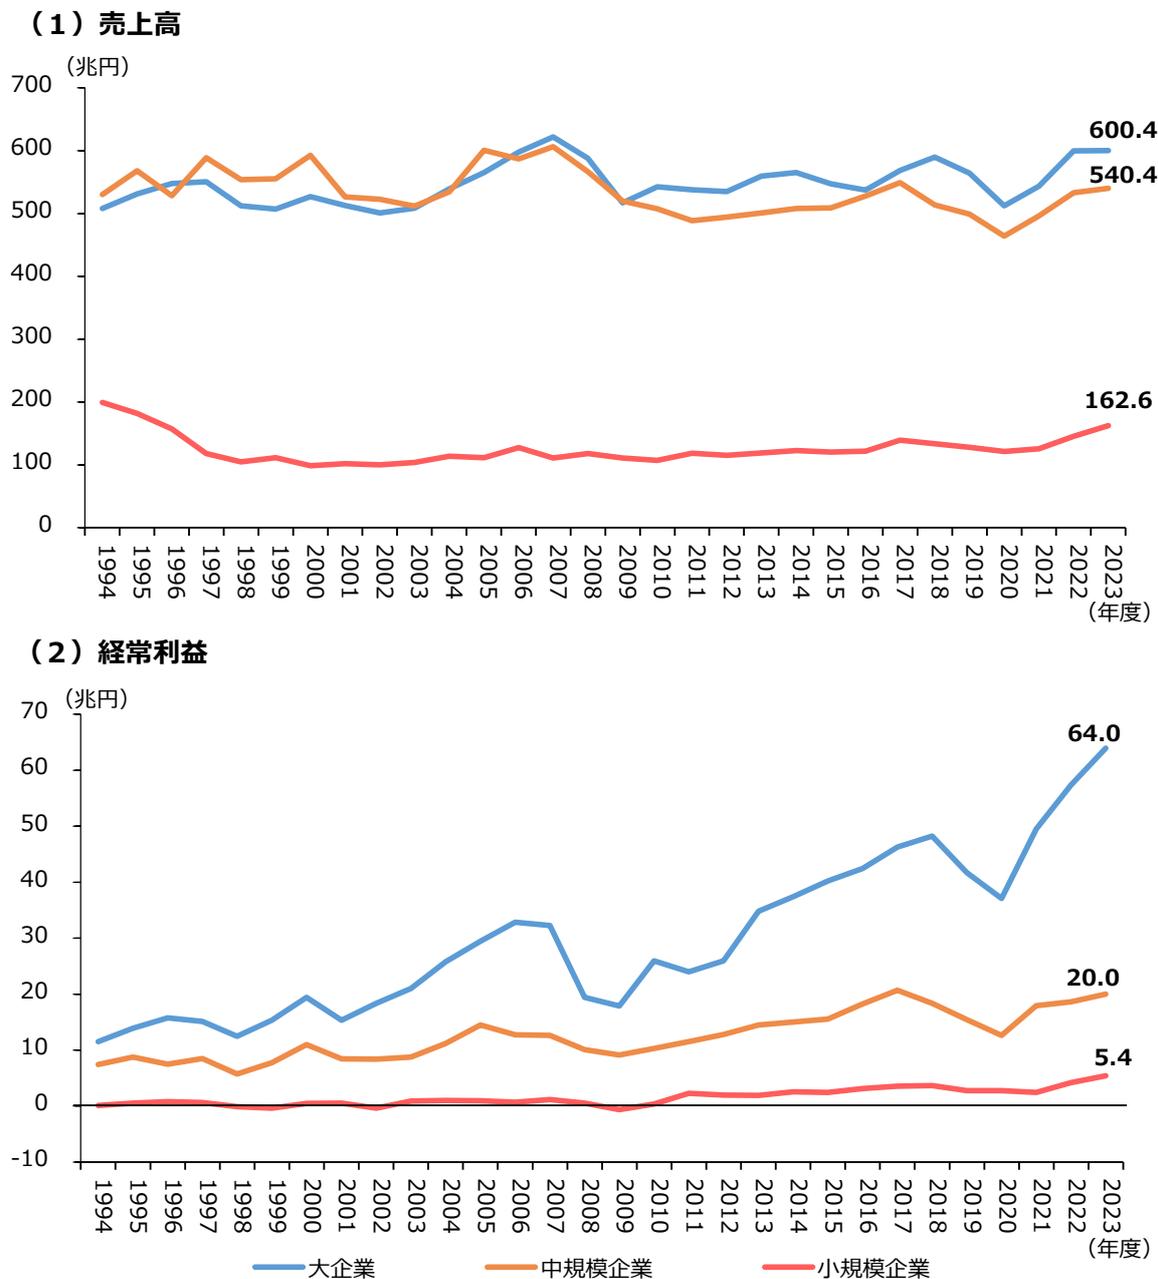
(1) 売上高
| 年度 | 大企業 | 中規模企業 | 小規模企業 |
|---|---|---|---|
| 1994 | 500.0 | 520.0 | 190.0 |
| 1995 | 530.0 | 560.0 | 170.0 |
| 1996 | 540.0 | 520.0 | 150.0 |
| 1997 | 510.0 | 580.0 | 120.0 |
| 1998 | 500.0 | 550.0 | 100.0 |
| 1999 | 500.0 | 550.0 | 110.0 |
| 2000 | 520.0 | 580.0 | 90.0 |
| 2001 | 510.0 | 520.0 | 90.0 |
| 2002 | 500.0 | 520.0 | 90.0 |
| 2003 | 510.0 | 530.0 | 100.0 |
| 2004 | 530.0 | 550.0 | 110.0 |
| 2005 | 560.0 | 590.0 | 110.0 |
| 2006 | 580.0 | 580.0 | 120.0 |
| 2007 | 610.0 | 600.0 | 110.0 |
| 2008 | 580.0 | 550.0 | 110.0 |
| 2009 | 510.0 | 510.0 | 110.0 |
| 2010 | 530.0 | 520.0 | 100.0 |
| 2011 | 530.0 | 480.0 | 110.0 |
| 2012 | 530.0 | 490.0 | 110.0 |
| 2013 | 550.0 | 500.0 | 110.0 |
| 2014 | 560.0 | 500.0 | 120.0 |
| 2015 | 540.0 | 500.0 | 120.0 |
| 2016 | 530.0 | 520.0 | 120.0 |
| 2017 | 570.0 | 540.0 | 130.0 |
| 2018 | 580.0 | 510.0 | 130.0 |
| 2019 | 560.0 | 500.0 | 120.0 |
| 2020 | 510.0 | 460.0 | 120.0 |
| 2021 | 530.0 | 500.0 | 120.0 |
| 2022 | 590.0 | 530.0 | 140.0 |
| 2023 | 600.4 | 540.4 | 162.6 |
(2) 経常利益
| 年度 | 大企業 | 中規模企業 | 小規模企業 |
|---|---|---|---|
| 1994 | 11.0 | 7.0 | 0.0 |
| 1995 | 13.0 | 8.0 | 0.0 |
| 1996 | 15.0 | 8.0 | 0.0 |
| 1997 | 14.0 | 8.0 | 0.0 |
| 1998 | 12.0 | 5.0 | 0.0 |
| 1999 | 14.0 | 7.0 | 0.0 |
| 2000 | 18.0 | 10.0 | 0.0 |
| 2001 | 14.0 | 8.0 | 0.0 |
| 2002 | 16.0 | 8.0 | 0.0 |
| 2003 | 20.0 | 8.0 | 0.0 |
| 2004 | 25.0 | 10.0 | 0.0 |
| 2005 | 28.0 | 13.0 | 0.0 |
| 2006 | 32.0 | 12.0 | 0.0 |
| 2007 | 32.0 | 12.0 | 0.0 |
| 2008 | 18.0 | 10.0 | 0.0 |
| 2009 | 17.0 | 8.0 | 0.0 |
| 2010 | 25.0 | 10.0 | 0.0 |
| 2011 | 23.0 | 11.0 | 0.0 |
| 2012 | 25.0 | 12.0 | 0.0 |
| 2013 | 34.0 | 14.0 | 0.0 |
| 2014 | 37.0 | 14.0 | 0.0 |
| 2015 | 40.0 | 15.0 | 0.0 |
| 2016 | 42.0 | 17.0 | 0.0 |
| 2017 | 45.0 | 20.0 | 0.0 |
| 2018 | 47.0 | 18.0 | 0.0 |
| 2019 | 40.0 | 15.0 | 0.0 |
| 2020 | 36.0 | 12.0 | 0.0 |
| 2021 | 48.0 | 17.0 | 0.0 |
| 2022 | 55.0 | 18.0 | 0.0 |
| 2023 | 64.0 | 20.0 | 5.4 |
Two line charts showing sales and ordinary income trends for large, medium, and small enterprises from 1994 to 2023. Chart (1) shows sales in millions of yen, and Chart (2) shows ordinary income in millions of yen. The final data points for 2023 are: Sales (Large: 600.4, Medium: 540.4, Small: 162.6) and Income (Large: 64.0, Medium: 20.0, Small: 5.4).
資料:財務省「法人企業統計調査年報」
(注)1.ここでの大企業とは資本金10億円以上、中規模企業とは資本金1千万円以上1億円未満、小規模企業とは資本金1千万円未満の企業とする。
2.金融業、保険業は含まない。