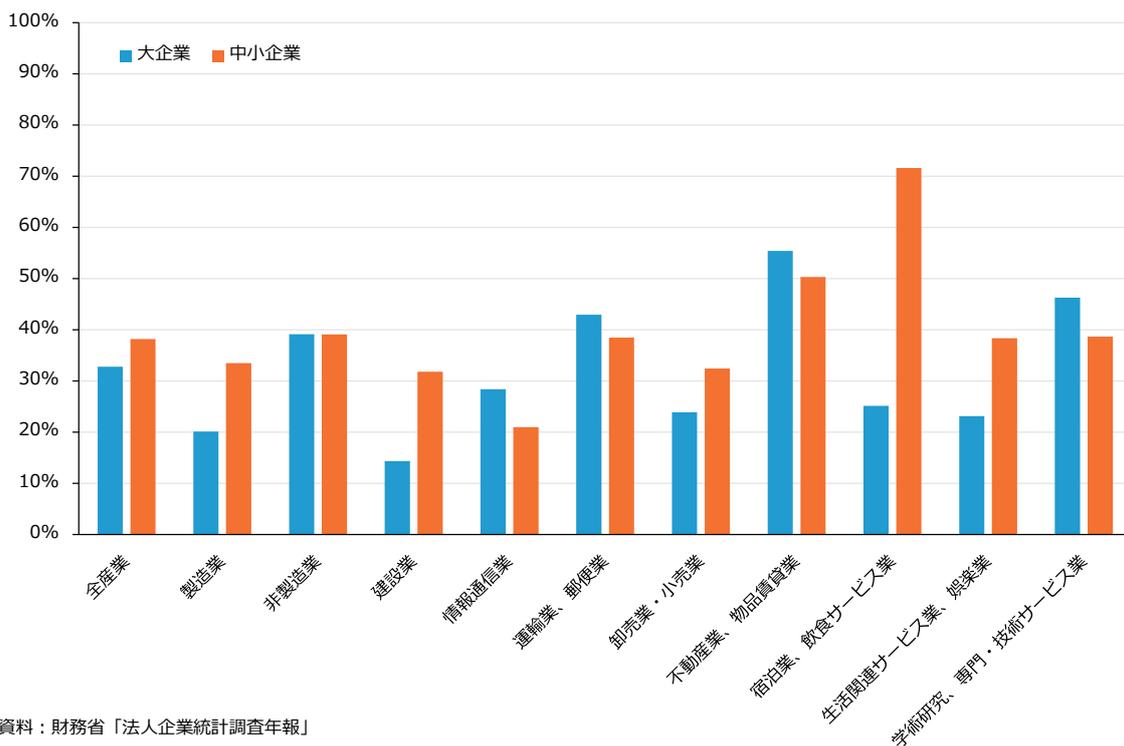
第1-1-14図は、企業規模別及び業種別に借入金依存度を見たものである。「全産業」を見ると「中小企業」は「大企業」と比較して借入金依存度が高い。業種別に見ると、特に「宿泊業、飲食サービス業」では企業規模間の差が大きく、「中
小企業」では7割を超えている。借入金利の上昇は支払利息の増加による経常利益の下押しにつながり、借入金依存度が高い業種では特にその影響が大きいと考えられる。
第1-1-14図 借入金依存度(企業規模別・業種別)
| 業種 | 大企業 (%) | 中小企業 (%) |
|---|---|---|
| 全産業 | 33 | 38 |
| 製造業 | 20 | 33 |
| 非製造業 | 39 | 39 |
| 建設業 | 14 | 32 |
| 情報通信業 | 28 | 21 |
| 運輸業、郵便業 | 43 | 38 |
| 卸売業・小売業 | 24 | 32 |
| 不動産業、物品賃貸業 | 55 | 50 |
| 宿泊業、飲食サービス業 | 25 | 71 |
| 生活関連サービス業、娯楽業 | 23 | 38 |
| 学術研究、専門・技術サービス業 | 46 | 38 |
Bar chart showing the debt dependency ratio (借入金依存度) for various industries, comparing large enterprises (大企業) and small and medium enterprises (中小企業). The Y-axis represents the percentage from 0% to 100%. The X-axis lists 11 industry categories. In most industries, small and medium enterprises show a higher debt dependency ratio than large enterprises. The highest ratio for small and medium enterprises is in the accommodation and food service industry (宿泊業、飲食サービス業), exceeding 70%.
資料:財務省「法人企業統計調査年報」
(注) 1. ここでの大企業とは資本金10億円以上、中小企業とは資本金1億円未満の企業とする。
2. 金融業・保険業を含まない。
3. 借入金依存度 = (金融機関借入金 + その他の借入金 + 社債) ÷ 負債・純資産合計。
4. 2023年度の実績について集計したもの。