②従業者数
ここからは、スケール変動状況別の従業者数や財務指標等の推移を確認していく。
始めに、従業者数の推移について確認する。第2-2-11図は、スケール変動状況別の従業者数の
推移について見たもので、これを見ると、「スケールアップ」、「維持」企業は、10年間で雇用を拡大してきた一方、「スケールダウン」企業は雇用縮小傾向にあることが分かる。
第2-2-11図 従業者数の推移(スケール変動状況別)
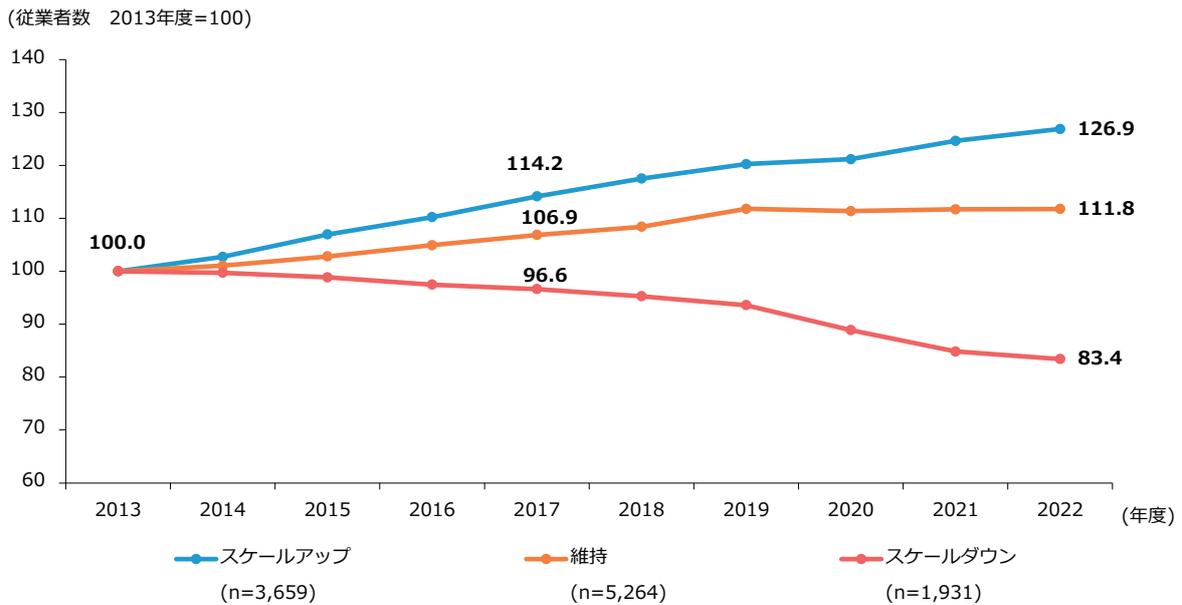
(従業者数 2013年度=100)
| 年度 | スケールアップ (n=3,659) | 維持 (n=5,264) | スケールダウン (n=1,931) |
|---|---|---|---|
| 2013 | 100.0 | 100.0 | 100.0 |
| 2014 | 102.5 | 101.5 | 99.5 |
| 2015 | 106.5 | 103.5 | 98.5 |
| 2016 | 110.5 | 105.5 | 97.5 |
| 2017 | 114.2 | 106.9 | 96.6 |
| 2018 | 117.5 | 108.5 | 95.5 |
| 2019 | 120.5 | 111.5 | 94.5 |
| 2020 | 121.5 | 111.5 | 90.5 |
| 2021 | 124.5 | 111.5 | 86.5 |
| 2022 | 126.9 | 111.8 | 83.4 |
Line graph showing the trend of employment numbers from 2013 to 2022 for three groups: Scale Up, Maintain, and Scale Down. The Y-axis represents the number of employees (2013=100) ranging from 60 to 140. The X-axis represents the year from 2013 to 2022. The Scale Up group (blue line) shows a steady increase, ending at 126.9 in 2022. The Maintain group (orange line) shows a slight increase, ending at 111.8 in 2022. The Scale Down group (red line) shows a steady decrease, ending at 83.4 in 2022.
資料:経済産業省「企業活動基本調査」再編加工
(注) 1.パネルデータを基に算出している。パネルデータの詳細は、第2部第2章第2節冒頭の脚注を参照。
2.従業者数は、「本社本店・本社以外・他企業出向者従業者数合計」の項目を集計している。
3.2013年度と比較した、2022年度までの変化を見たもの。