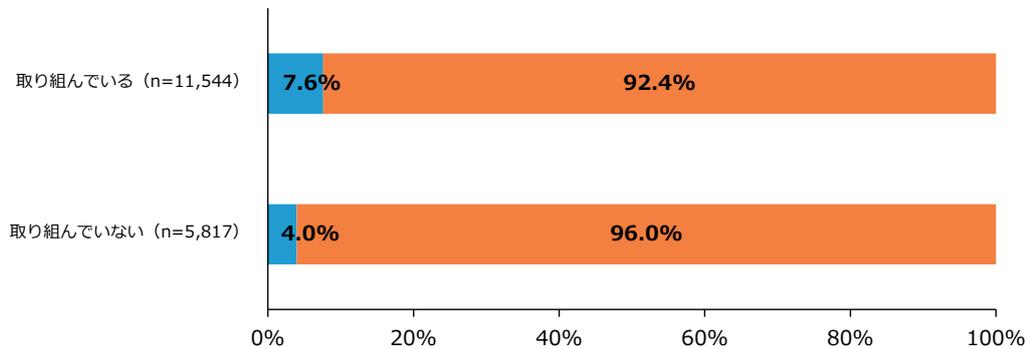
第2-2-30図 スケール変動状況(意思決定プロセスの明確化に向けた取組状況別)
(1) 売上高10億円未満(5期前)
| 取組状況 | スケールアップ | 横ばい・スケールダウン |
|---|---|---|
| 取り組んでいる (n=11,544) | 7.6% | 92.4% |
| 取り組んでいない (n=5,817) | 4.0% | 96.0% |
Stacked bar chart showing scale change status for companies with sales under 100 million yen 5 periods ago. The chart compares '取り組んでいる' (n=11,544) and '取り組んでいない' (n=5,817) groups. The 'スケールアップ' (Scale Up) rate is 7.6% for the '取り組んでいる' group and 4.0% for the '取り組んでいない' group. The '横ばい・スケールダウン' (Stagnation/Scale Down) rate is 92.4% for the '取り組んでいる' group and 96.0% for the '取り組んでいない' group.
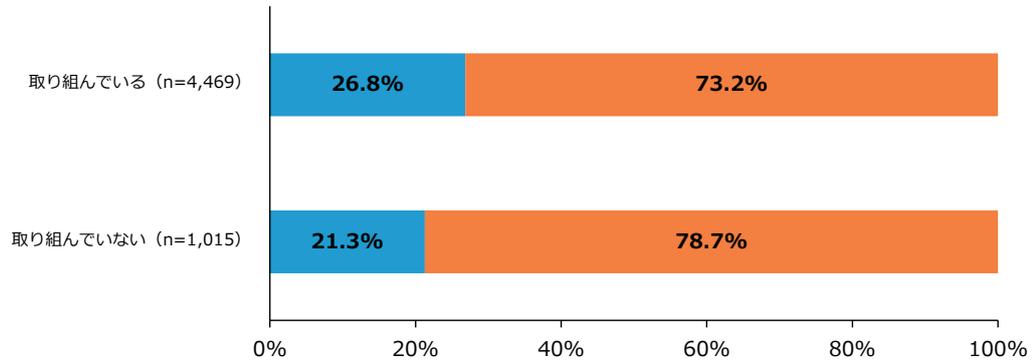
(2) 売上高10億円以上~50億円未満(5期前)
| 取組状況 | スケールアップ | 横ばい・スケールダウン |
|---|---|---|
| 取り組んでいる (n=4,469) | 26.8% | 73.2% |
| 取り組んでいない (n=1,015) | 21.3% | 78.7% |
Stacked bar chart showing scale change status for companies with sales between 100 million and 500 million yen 5 periods ago. The chart compares '取り組んでいる' (n=4,469) and '取り組んでいない' (n=1,015) groups. The 'スケールアップ' (Scale Up) rate is 26.8% for the '取り組んでいる' group and 21.3% for the '取り組んでいない' group. The '横ばい・スケールダウン' (Stagnation/Scale Down) rate is 73.2% for the '取り組んでいる' group and 78.7% for the '取り組んでいない' group.
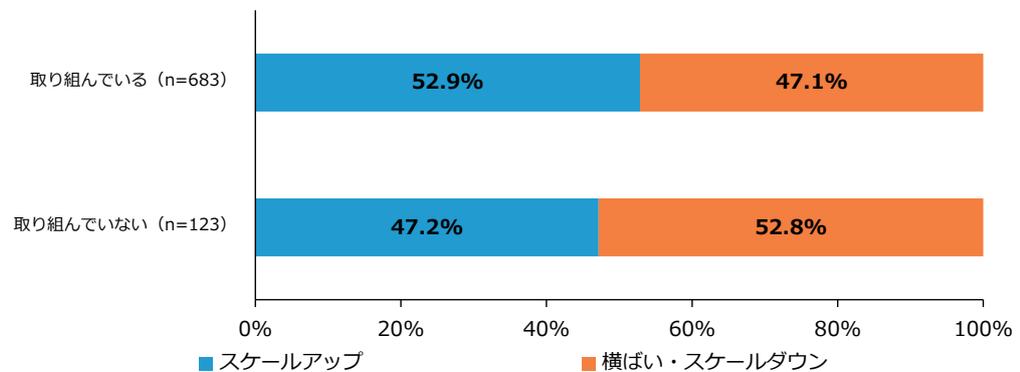
(3) 売上高50億円以上~100億円未満(5期前)
| 取組状況 | スケールアップ | 横ばい・スケールダウン |
|---|---|---|
| 取り組んでいる (n=683) | 52.9% | 47.1% |
| 取り組んでいない (n=123) | 47.2% | 52.8% |
Stacked bar chart showing scale change status for companies with sales between 500 million and 1 billion yen 5 periods ago. The chart compares '取り組んでいる' (n=683) and '取り組んでいない' (n=123) groups. The 'スケールアップ' (Scale Up) rate is 52.9% for the '取り組んでいる' group and 47.2% for the '取り組んでいない' group. The '横ばい・スケールダウン' (Stagnation/Scale Down) rate is 47.1% for the '取り組んでいる' group and 52.8% for the '取り組んでいない' group.
資料:(株)帝国データバンク「令和6年度中小企業の経営課題と事業活動に関する調査」
(注)1.5期前と今期見通しの売上高を比較して、第2-2-6図の売上高区分を基に、上方遷移した場合を「スケールアップ」、スケールの変動がない場合又は下方遷移した場合を「横ばい・スケールダウン」と定義している。
2.「取り組んでいる」は、「十分取り組んでいる」、「ある程度取り組んでいる」の合計。「取り組んでいない」は、「あまり取り組んでいない」、「ほとんど取り組んでいない」の合計。