2. M & A
第2-2-41図では、企業規模を拡大するに当たって重要な投資戦略について、スケールが大きくなるほど「M & A(水平・垂直)」、「M & A(多角化)」と回答している事業者の割合が高くなっており、将来的に100億企業を目指すに当たっては重要性が増す投資行動である可能性を確認した。本項では、M & Aの実施状況、その目的や効果等について、スケールアップとの関係性に焦点を当て、分析を進めていく。
① M & Aの実施状況と効果
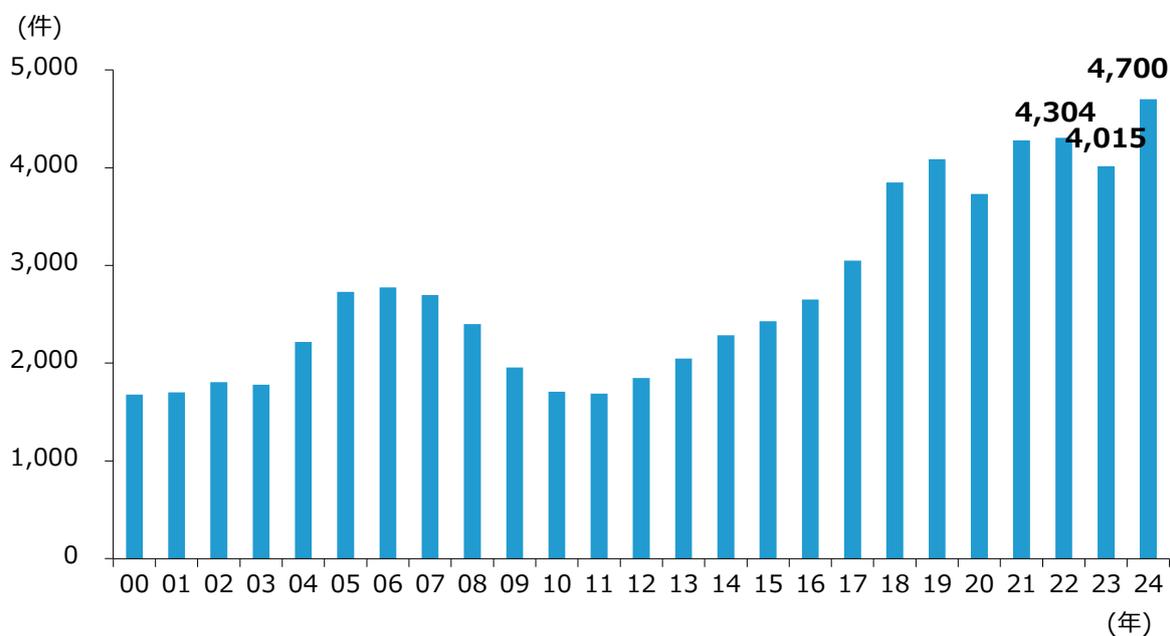
第2-2-48図は、我が国企業のM & A件数の推移を見たものである。(株)レコフデータの調べによると、M & Aの件数は近年増加傾向で推移しており、2024年には過去最多の4,700件となった。これらはあくまでも公表されている件数であるが、M & Aについては未公表のものも一定数存在することを考慮すると、我が国におけるM & Aは更に活発化していることが推察される。
第2-2-48図 M&A件数の推移
| 年 | M&A件数 |
|---|---|
| 00 | 1,600 |
| 01 | 1,650 |
| 02 | 1,750 |
| 03 | 1,700 |
| 04 | 2,200 |
| 05 | 2,700 |
| 06 | 2,750 |
| 07 | 2,650 |
| 08 | 2,400 |
| 09 | 1,900 |
| 10 | 1,650 |
| 11 | 1,650 |
| 12 | 1,800 |
| 13 | 2,000 |
| 14 | 2,250 |
| 15 | 2,400 |
| 16 | 2,600 |
| 17 | 3,000 |
| 18 | 3,800 |
| 19 | 4,000 |
| 20 | 3,700 |
| 21 | 4,304 |
| 22 | 4,015 |
| 23 | 4,700 |
| 24 | 4,700 |
Bar chart showing the number of M&A cases in Japan from 2000 to 2024. The y-axis represents the number of cases (0 to 5,000) and the x-axis represents the year (00 to 24). The number of cases shows a general upward trend, with a peak of 4,700 in 2024.
資料:(株)レコフデータ調べ