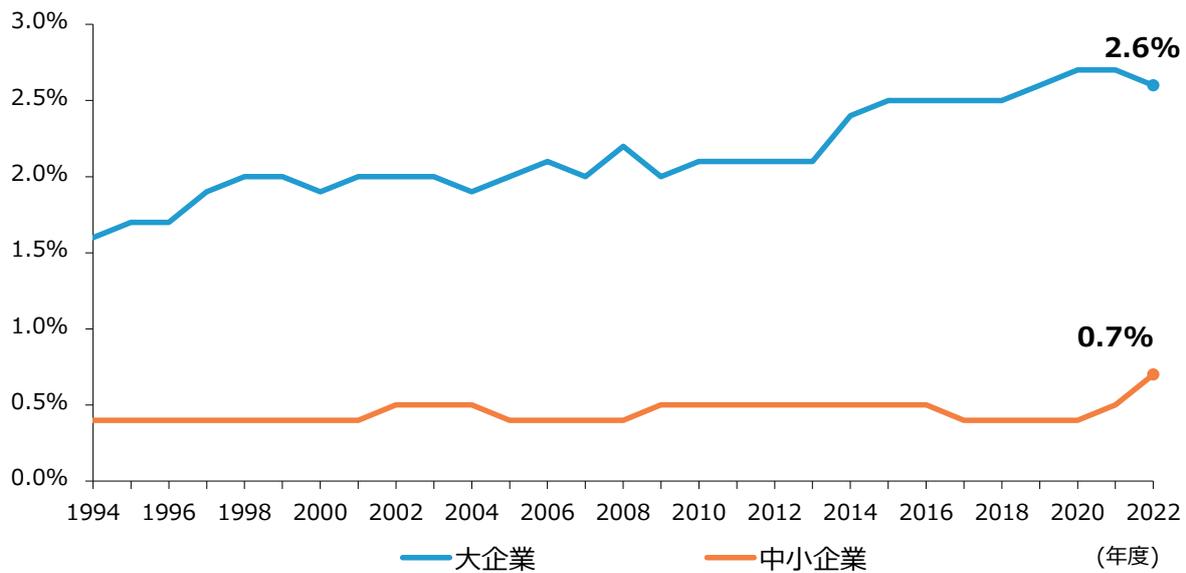
第2-2-70図は、企業規模別に見た売上高比研究開発費の推移である。第2-2-69図では研究開発費の実額が足下で増加している傾向を確認したが、売上高に対する比率においても、「中小企業」は2020年度以降で上昇傾向にある。一方で、「大企業」は上昇基調で推移してきたが、直近で下落
に転じていることが分かる。「中小企業」の研究開発投資は、「大企業」と比較すると、実額、売上高比率共に水準は低いものの、いずれも増加又は上昇傾向にあり、取組が進んでいることがうかがえる。
第2-2-70図 売上高比研究開発費の推移(企業規模別)
| 年度 | 大企業 (%) | 中小企業 (%) |
|---|---|---|
| 1994 | 1.6 | 0.4 |
| 1996 | 1.7 | 0.4 |
| 1998 | 2.0 | 0.4 |
| 2000 | 1.9 | 0.4 |
| 2002 | 2.0 | 0.5 |
| 2004 | 1.9 | 0.5 |
| 2006 | 2.1 | 0.4 |
| 2008 | 2.2 | 0.4 |
| 2010 | 2.1 | 0.5 |
| 2012 | 2.1 | 0.5 |
| 2014 | 2.4 | 0.5 |
| 2016 | 2.5 | 0.5 |
| 2018 | 2.5 | 0.4 |
| 2020 | 2.7 | 0.4 |
| 2022 | 2.6 | 0.7 |
Line graph showing the trend of R&D expenses as a percentage of sales for large and small enterprises from 1994 to 2022. The Y-axis represents the percentage from 0.0% to 3.0%. The X-axis represents the year from 1994 to 2022. The blue line represents large enterprises (大企業) and the orange line represents small enterprises (中小企業). The final data points for 2022 are 2.6% for large enterprises and 0.7% for small enterprises.
資料:経済産業省「企業活動基本調査」再編加工
(注)中小企業と大企業の分類は、中小企業基本法上の定義に基づく。