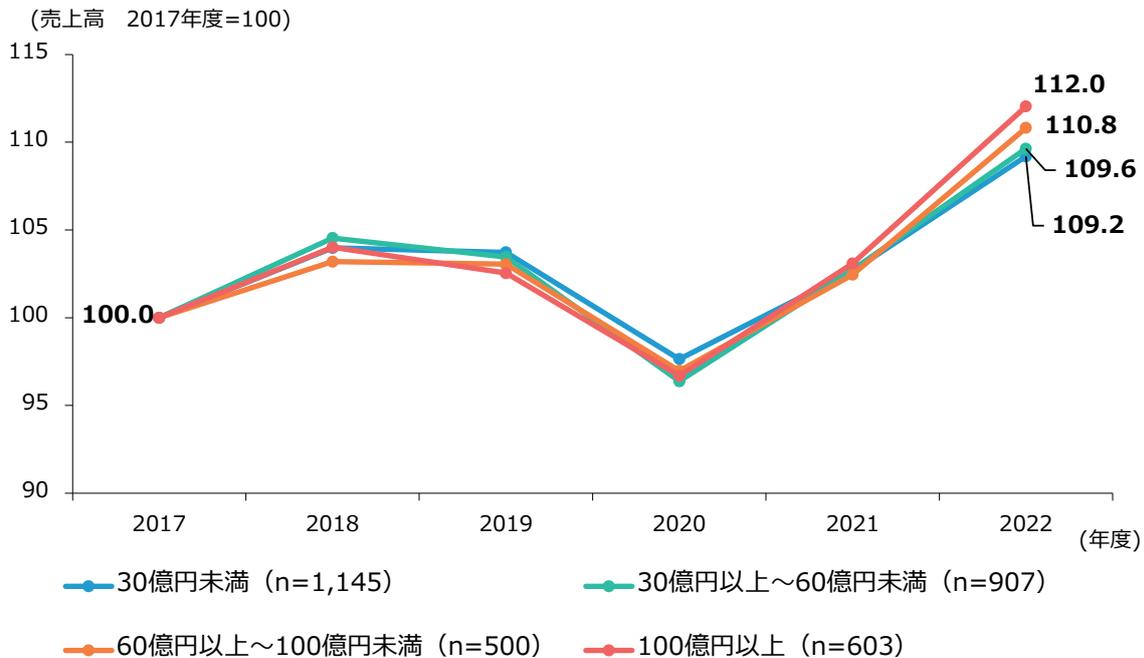
第2-2-72図は、2017年度のスケール別に研究開発投資を実施した企業の売上高の推移を見たものである。これを見ると、2022年度時点において、いずれのスケールにおいても、2017年度比
で10%程度売上高を高めていることが分かる。研究開発投資は、スケールを問わず、スケールアップに向けて一定程度有効であることが示唆される。
第2-2-72図 研究開発投資実施企業の売上高の推移(スケール別)
| 年度 | 30億円未満 (n=1,145) | 30億円以上~60億円未満 (n=907) | 60億円以上~100億円未満 (n=500) | 100億円以上 (n=603) |
|---|---|---|---|---|
| 2017 | 100.0 | 100.0 | 100.0 | 100.0 |
| 2018 | 104.5 | 104.0 | 103.5 | 103.0 |
| 2019 | 103.5 | 103.0 | 102.5 | 102.0 |
| 2020 | 97.5 | 97.0 | 96.5 | 96.0 |
| 2021 | 103.0 | 102.5 | 102.0 | 101.5 |
| 2022 | 109.2 | 109.6 | 110.8 | 112.0 |
Line graph showing the trend of sales volume for companies implementing R&D investment, categorized by scale, from 2017 to 2022. The Y-axis represents sales volume with 2017 as the base (100.0). The X-axis represents the year. Four lines represent different scales: 30 billion yen or less (n=1,145), 30 billion yen or more to 60 billion yen or less (n=907), 60 billion yen or more to 100 billion yen or less (n=500), and 100 billion yen or more (n=603). All scales show a dip in 2020 followed by a sharp recovery in 2022, with the largest scale (100 billion yen or more) showing the highest growth.
資料:経済産業省「企業活動基本調査」再編加工
(注)1.パネルデータを基に算出している。パネルデータの詳細は、第2部第2章第2節冒頭の脚注を参照。
2.ここでいう「研究開発投資実施」とは、2017年度において、「自社研究開発費」及び「委託研究開発費」の合計額が0(調査票上の単位はそれぞれ百万円)より大きい場合をいう。
3.2017年度の数値を100として、2017年度から2022年度までの変化を見たもの。
4.スケールは、2017年度の実績である。