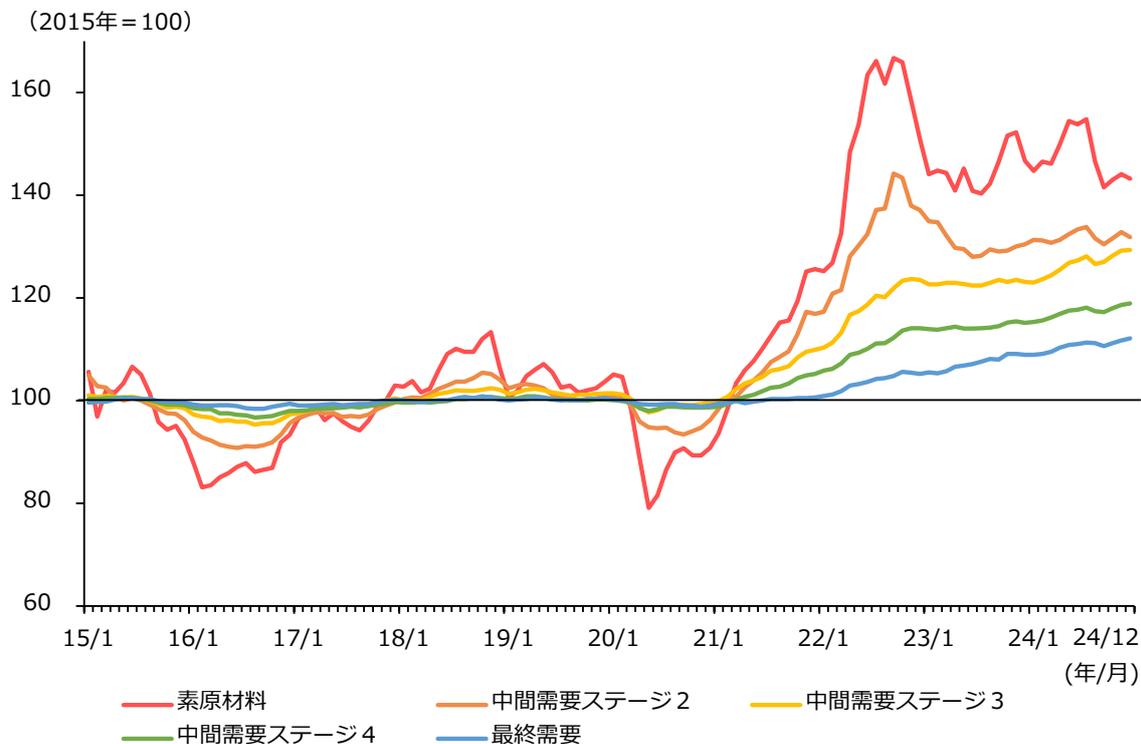
第1-1-19図は、日本銀行「最終需要・中間需要物価指数」を用いて、需要段階別の物価の推移を見たものである。これを見ると、「原材料」
は2022年と比較すると低下したものの、中長期的に見れば高水準が続いている。「中間需要」や「最終需要」についても、上昇を続けている。
第1-1-19図 最終需要・中間需要物価指数の推移
| 年/月 | 原材料 | 中間需要ステージ2 | 中間需要ステージ3 | 中間需要ステージ4 | 最終需要 |
|---|---|---|---|---|---|
| 15/1 | 100 | 100 | 100 | 100 | 100 |
| 16/1 | 95 | 98 | 98 | 98 | 98 |
| 17/1 | 98 | 100 | 100 | 100 | 100 |
| 18/1 | 105 | 102 | 102 | 102 | 102 |
| 19/1 | 110 | 105 | 105 | 105 | 105 |
| 20/1 | 80 | 95 | 95 | 95 | 95 |
| 21/1 | 100 | 100 | 100 | 100 | 100 |
| 22/1 | 125 | 115 | 110 | 105 | 100 |
| 23/1 | 145 | 135 | 125 | 115 | 105 |
| 24/1 | 145 | 130 | 125 | 115 | 110 |
| 24/12 | 140 | 135 | 130 | 120 | 115 |
Line chart showing the trend of price indices for raw materials, intermediate needs stages 2, 3, and 4, and final needs from 2015 to 2024. The y-axis represents the index (2015=100) ranging from 60 to 160. The x-axis shows dates from 15/1 to 24/12. The red line (raw materials) shows the most volatility, peaking around 165 in early 2023. The other lines (orange, yellow, green, blue) show a more steady upward trend, ending between 110 and 135 in late 2024.
資料:日本銀行「最終需要・中間需要物価指数」
(注)1.各指数について、財だけでなくサービスも含む。
2.「原材料」については、「中間需要ステージ1」を集計している。
3.「最終需要」については、「最終需要(除く輸出)」を集計している。