コラム1-1-5⑤図は、業種間における同様の分析結果を示したものである。(1)のネットワークの類似度を示した行列から、「スーパー」、「コンビニ」、「衣料品専門店」などの間で高い類似度が観察される。また、(2)のネットワーク間の類似度を基に各業種をt-SNEによって低次元化した図からは、事業環境が類似している業種が空間的に近接して配置される傾向が見られ、これは直感的な業種間の関係性とも整合的である。このような分析結果は、構築されたネットワークがマクロ的な産業構造を適切に捉えていることを示唆している。
コラム 1-1-5⑤図 業種ごとに見たネットワークの類似度
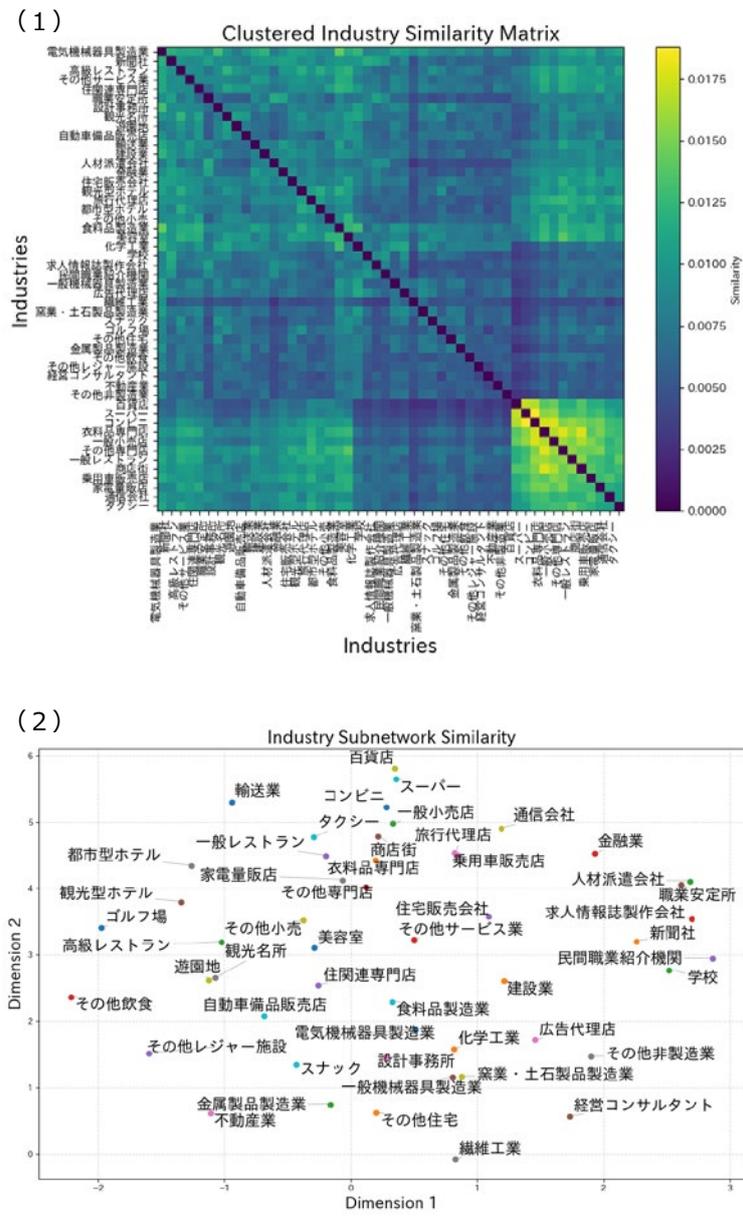
(1) Clustered Industry Similarity Matrix
This heatmap displays the similarity between various industries. The axes are labeled with industry names such as 電気機械器具製造業, 自動車部品, 人材派遣, 飲食, 建設業, etc. The color scale on the right indicates similarity values from 0.0000 (dark blue) to 0.0175 (yellow). Brighter colors indicate higher similarity, notably between 衣料品専門店, コンビニ, and スーパー.
(2) Industry Subnetwork Similarity
This t-SNE plot shows the low-dimensional representation of industries based on network similarity. The x-axis is Dimension 1 and the y-axis is Dimension 2. Industries are clustered based on similarity, with 衣料品専門店, コンビニ, and スーパー appearing in close proximity.
資料:内閣府「景気ウォッチャー調査」より中小企業庁作成
(注) 1. (1)は、業種ごとに作成したネットワークを各業種同士で確認した類似度について行列として表したもので、色が明るいほどネットワークの類似度が高く、暗いほど類似度が低いことを表す。
2. (2)は、多次元空間で表されるネットワークに対して低次元化する処理を行うことで、ネットワークの類似度を二次元に可視化したもの。類似度の高いネットワークは近接して表示されている。