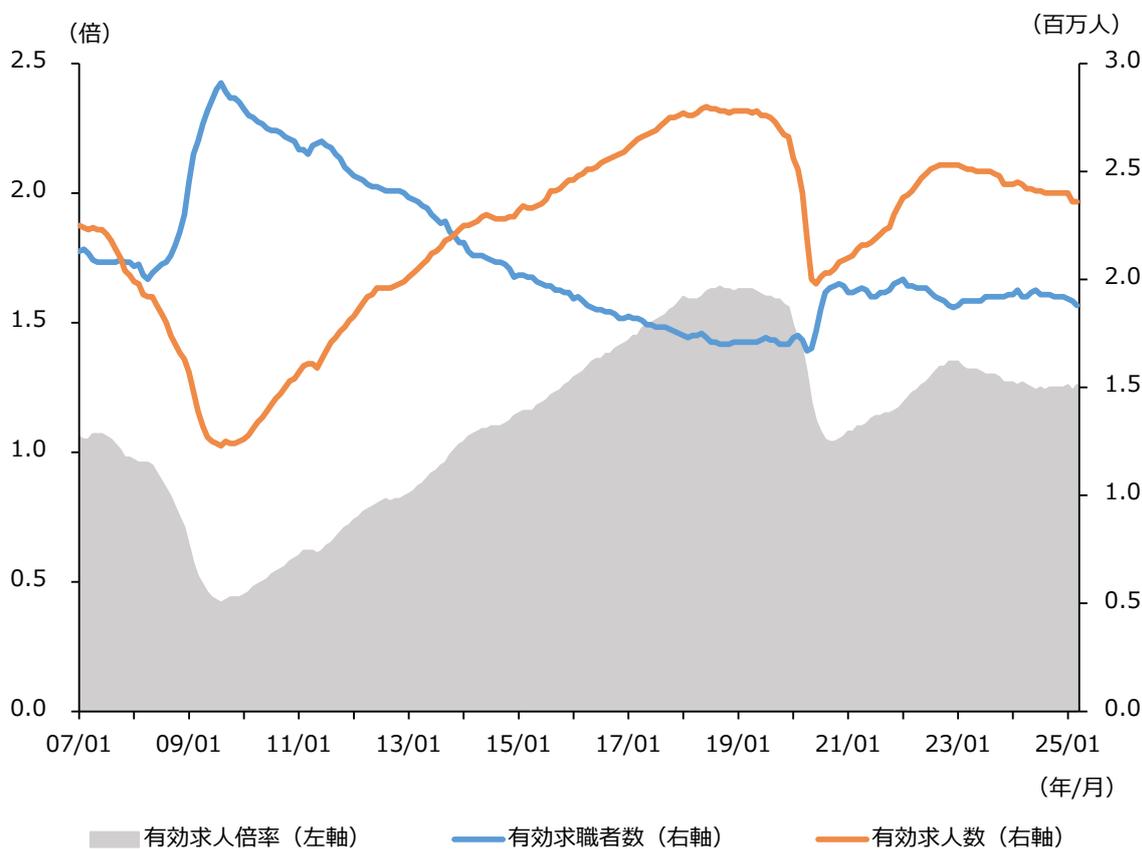
第1-1-25図は、厚生労働省「職業安定業務統計」を用いて、有効求人倍率、有効求職者数及び有効求人数の推移を見たものである。これを見る
と、足下では「有効求人倍率」、「有効求職者数」及び「有効求人数」のいずれもおおむね横ばいであることが分かる。
第1-1-25図 有効求人倍率・有効求職者数・有効求人数の推移
(倍)
(百万人)
07/01 09/01 11/01 13/01 15/01 17/01 19/01 21/01 23/01 25/01
(年/月)
■ 有効求人倍率(左軸) — 有効求職者数(右軸) — 有効求人数(右軸)
A line and area chart showing the trend of the effective job opening ratio, effective number of job seekers, and effective number of job openings from July 2023 to January 2025. The chart has a dual y-axis: the left axis for the job opening ratio (0.0 to 2.5) and the right axis for the number of job seekers and openings in millions (0.0 to 3.0). The x-axis shows dates from 07/01 to 25/01. The effective job opening ratio is shown as a grey shaded area. The effective number of job seekers is a blue line, and the effective number of job openings is an orange line. The ratio peaked in late 2023 and has since declined. The number of job openings peaked in early 2024 and has declined, while the number of job seekers has remained relatively stable.
資料:厚生労働省「職業安定業務統計」
(注)季節調整値。