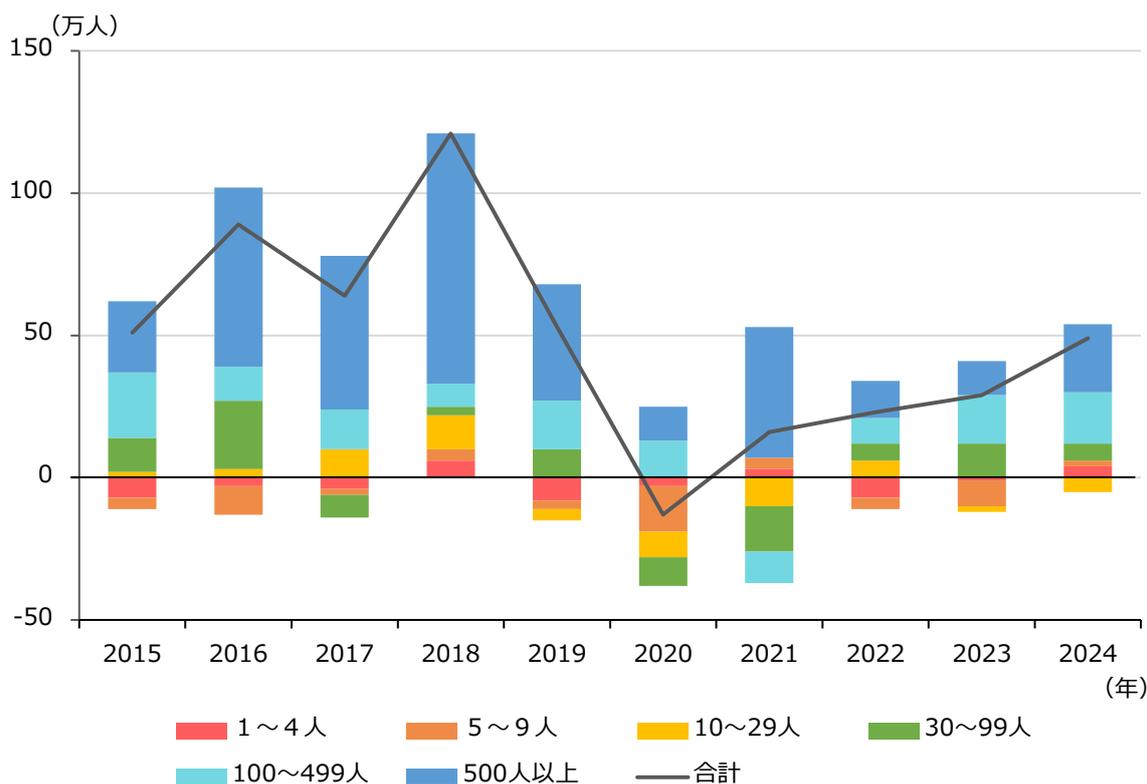
また、従業員規模別に雇用者数の増減の推移(前年比)を見ると、「合計」は増加傾向にあり、中でも、「500人以上」及び「100~499人」の従業員規模が比較的大きい事業者における増加数
が大きい。「1~4人」、「5~9人」では2024年で増加に転じた一方、「10~29人」の事業者では減少が続いた(第1-1-28図)。
第1-1-28図 雇用者数の増減の推移(前年比、従業員規模別)
| 年 | 1~4人 | 5~9人 | 10~29人 | 30~99人 | 100~499人 | 500人以上 | 合計 |
|---|---|---|---|---|---|---|---|
| 2015 | -10 | -10 | 0 | 10 | 20 | 25 | 50 |
| 2016 | -10 | -10 | 0 | 20 | 10 | 60 | 90 |
| 2017 | -5 | -5 | 5 | 5 | 15 | 55 | 65 |
| 2018 | 5 | 5 | 10 | 10 | 10 | 85 | 120 |
| 2019 | -5 | -5 | 0 | 10 | 15 | 40 | 55 |
| 2020 | -10 | -10 | -5 | -10 | -5 | 10 | -15 |
| 2021 | 5 | 5 | 0 | 10 | 10 | 45 | 75 |
| 2022 | 0 | 0 | 0 | 5 | 10 | 30 | 45 |
| 2023 | 0 | 0 | 0 | 10 | 15 | 35 | 60 |
| 2024 | 5 | 5 | 0 | 10 | 20 | 40 | 80 |
Stacked bar chart showing the year-on-year change in employment by employee size category from 2015 to 2024. The Y-axis represents the number of people in thousands, ranging from -50 to 150. The X-axis represents the years. The legend indicates six categories: 1-4 people (red), 5-9 people (orange), 10-29 people (yellow), 30-99 people (green), 100-499 people (light blue), 500 or more people (dark blue), and a black line for the total. The total employment change peaked in 2018 at approximately 120,000 people and reached a low of about -15,000 in 2020. By 2024, the total change was positive at approximately 50,000 people, with the largest contributions from the 500+ and 100-499 categories.
資料:総務省「労働力調査(基本集計)」
(注)1.農林業・漁業を除く雇用者数の増減を示している。
2.「合計」については、各系列の合計となっており、雇用者総数とは異なる。
3.2020年国勢調査結果に基づく推計人口をベンチマークとして遡及又は補正した時系列接続用数値を用いている。