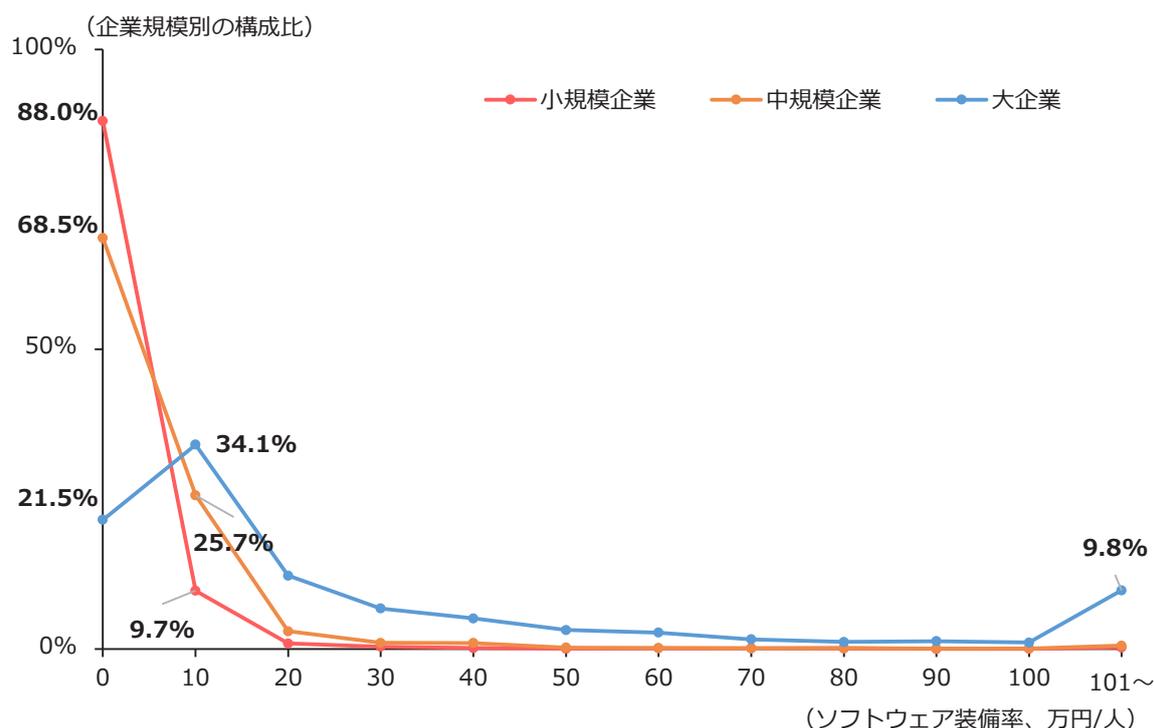
第1-1-38図は、ソフトウェア装備率の分布状況を企業規模別に見たものである。これを見ると、ソフトウェア装備率がゼロ 45 である企業の割合は、「大企業」で約2割である一方、「中規模企業」では約7割、「小規模企業」は約9割となっている。なお、ここでのソフトウェア装備率は
「無形固定資産のうちソフトウェアに関する投資額」を集計したもので、例えばSaaS 46 等のクラウドサービスのように、一定の利用料を支払うことでソフトウェアをサービスとして利用する仕組み等、資産計上されないものは含まれていないことに留意が必要である。
第1-1-38図 ソフトウェア装備率の分布(企業規模別)
| ソフトウェア装備率 (万円/人) | 小規模企業 (%) | 中規模企業 (%) | 大企業 (%) |
|---|---|---|---|
| 0 | 88.0 | 68.5 | 21.5 |
| 10 | 9.7 | 25.7 | 34.1 |
| 20 | 0.0 | 0.0 | 15.0 |
| 30 | 0.0 | 0.0 | 10.0 |
| 40 | 0.0 | 0.0 | 8.0 |
| 50 | 0.0 | 0.0 | 5.0 |
| 60 | 0.0 | 0.0 | 4.0 |
| 70 | 0.0 | 0.0 | 3.0 |
| 80 | 0.0 | 0.0 | 2.0 |
| 90 | 0.0 | 0.0 | 1.0 |
| 100 | 0.0 | 0.0 | 0.0 |
| 101~ | 0.0 | 0.0 | 9.8 |
資料:中小企業庁「中小企業実態基本調査」再編加工、経済産業省「企業活動基本調査」再編加工
(注) 1.本集計において、中小企業(中規模企業、小規模企業)は「中小企業実態基本調査」(令和4年度決算実績)から集計しており、大企業は「企業活動基本調査」(2022年度実績)から集計している。なお、「中小企業実態基本調査」は拡大個票により集計したものである。
2.ソフトウェア装備率(万円/人)= ソフトウェア投資額(無形固定資産、うちソフトウェア)÷ 従業者数。
3.企業規模ごとに、ソフトウェア装備率(千円単位を四捨五入)別の企業数の割合を表示しており、101万円/人以上は集約して集計している。
4.各平均値は、大企業52.9万円/人、中規模企業3.7万円/人、小規模企業2.6万円/人。
45 ソフトウェア装備率の千円単位を四捨五入しているため、必ずしも全ての企業のソフトウェア投資額がゼロではない可能性がある。
46 SaaS (Software as a Service) とは、特定又は不特定のユーザーが必要とするシステム機能を、ネットワークを通じて提供するサービスのことをいう。近年はこうしたサービスを活用するデジタル化の選択肢も存在しており、中小企業庁の補助金では、このようなデジタル化も補助の対象としている。