第1-1-40図は貯蓄と投資の差額の推移を企業規模別に見たものである。これを見ると、「大企
業」に比べて水準は低いものの、「中小企業」においても「貯蓄投資差額」が増加傾向にある。
第1-1-40図 貯蓄投資差額の推移(企業規模別)
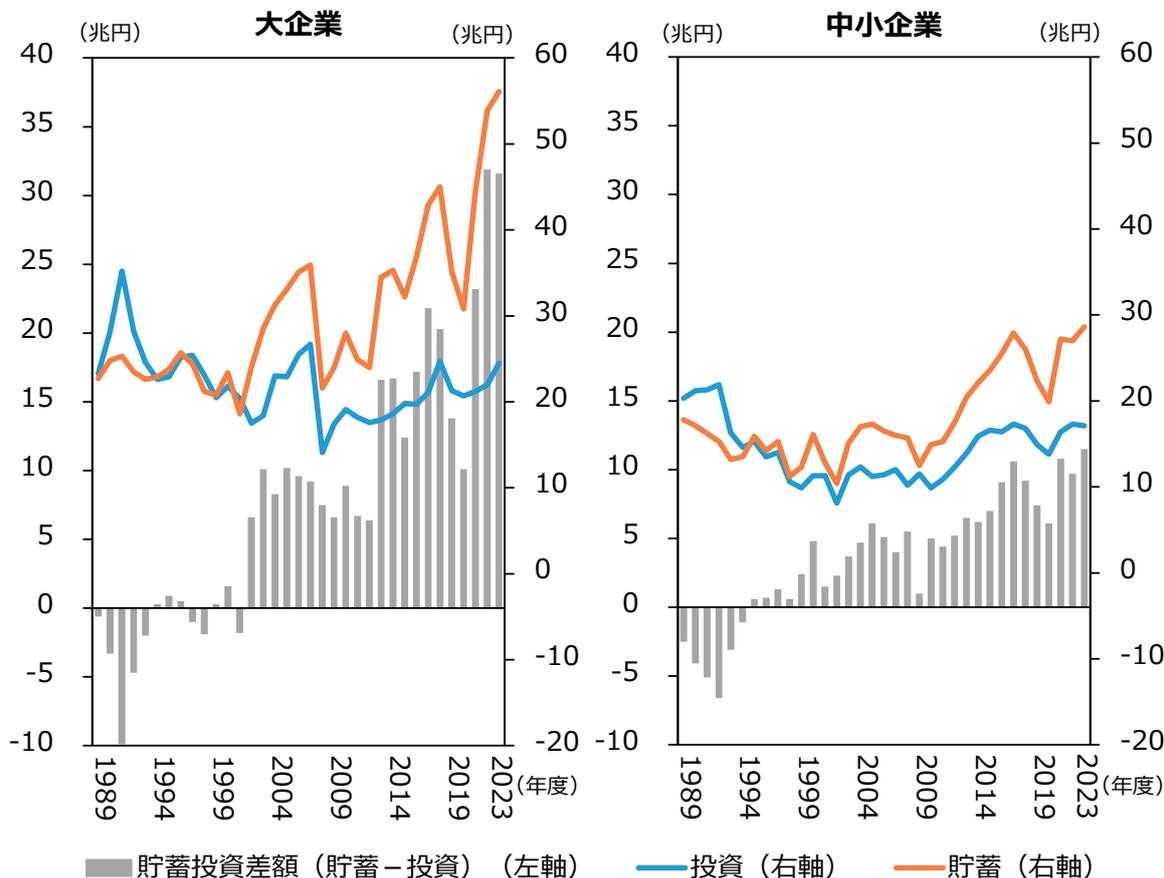
■ 貯蓄投資差額(貯蓄-投資)(左軸) — 投資(右軸) — 貯蓄(右軸)
Two charts comparing savings and investment trends for large enterprises (大企業) and small enterprises (中小企業) from 1989 to 2023. The left chart for large enterprises shows a significant increase in savings (orange line) and investment (blue line) starting around 2014, with the savings gap (gray bars) becoming positive and growing. The right chart for small enterprises shows a more stable trend with lower overall values, but a similar upward trend in the savings gap starting around 2014.
資料:財務省「法人企業統計調査年報」
(注)1.ここでの大企業とは資本金10億円以上の企業、中小企業とは資本金1億円未満の企業とする。
2.金融業、保険業は含まない。
3.投資=ソフトウェアを除く設備投資。
4.貯蓄=当期純利益-配当金+減価償却費。
事例1-1-1では、伝統工芸の技術継承のための人材育成に当たり、AIを活用することで職人育成と業務効率化の両立を実現した企業の事例を紹介する。
事例1-1-2では、積極的な省力化投資で作業工程の自動化に取り組み、業務効率化と賃上げを実現した企業の事例を紹介する。