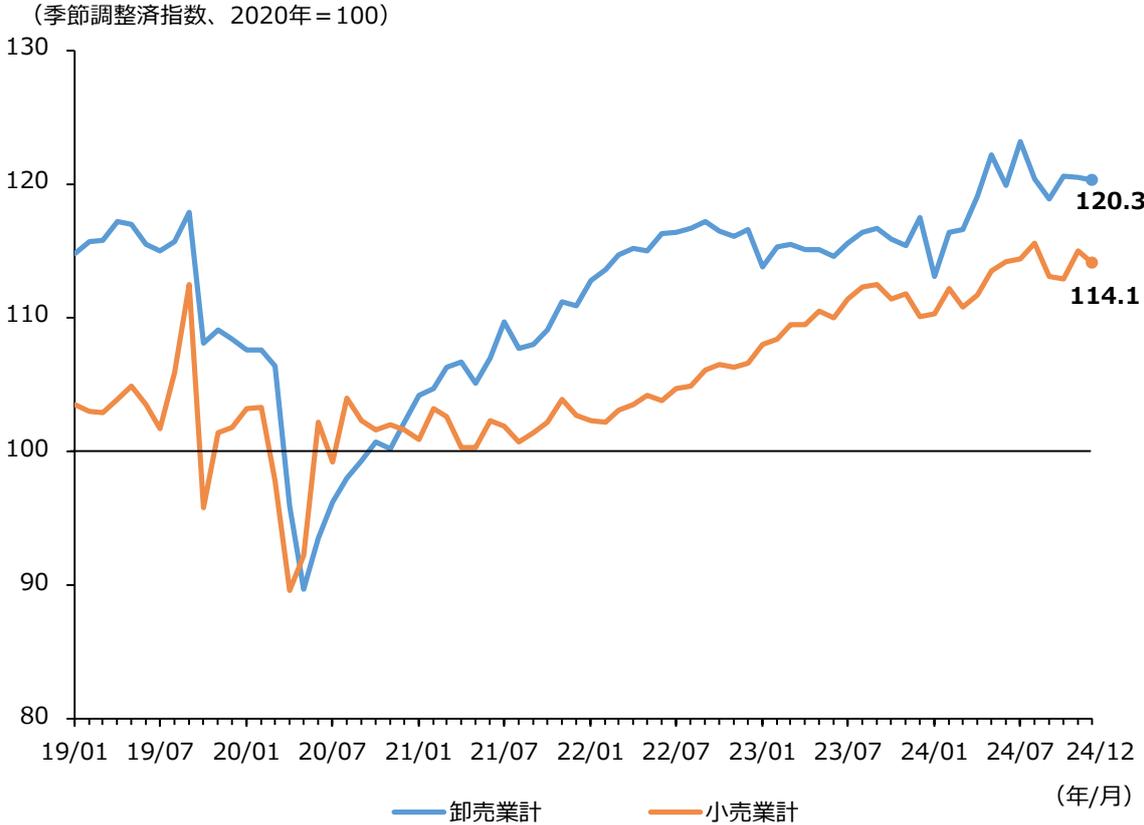
経済産業省「商業動態統計調査」を用いて、消費の動向を供給側から見ると、2020年3月から5月にかけて、卸売業、小売業共に大幅に低下し
たが、以降は足下にかけて緩やかな上昇傾向にある(第1-1-4図)。
第1-1-4図 商業販売額指数の推移
| 年/月 | 卸売業計 (Index) | 小売業計 (Index) |
|---|---|---|
| 19/01 | ~115 | ~103 |
| 20/01 | ~108 | ~103 |
| 20/07 | ~90 | ~90 |
| 21/01 | ~105 | ~102 |
| 21/07 | ~108 | ~102 |
| 22/01 | ~112 | ~103 |
| 22/07 | ~116 | ~105 |
| 23/01 | ~114 | ~108 |
| 23/07 | ~116 | ~111 |
| 24/01 | ~113 | ~110 |
| 24/07 | ~120 | ~114 |
| 24/12 | 120.3 | 114.1 |
Line chart showing the trend of the Commercial Sales Volume Index (Seasonally Adjusted, 2020=100) from January 2019 to December 2024. The chart compares Wholesale (卸売業計, blue line) and Retail (小売業計, orange line). Both indices show a sharp decline in early 2020, followed by a recovery. As of December 2024, the Wholesale index is 120.3 and the Retail index is 114.1.
資料:経済産業省「商業動態統計調査」
(注)指数値は、「2024年12月分」(2025年2月17日公表)による。
第1節 第2節 第3節 第4節 第5節 第6節 第7節 第8節 第9節