財務省「貿易統計」を用いて、国・地域別の輸出入数量の推移を見ていく。輸出数量指数の推移を見ると、足下では「米国」、「EU」が大きく上昇していることが見て取れる(第1-1-5図)。
輸入数量指数の推移を見ると、「米国」は
2020年の水準を下回る推移が続いているほか、「EU」は2024年1月及び11月に大きな落ち込みが見られた。2024年12月は、いずれの地域も回復している(第1-1-6図)。
第1-1-5図 輸出数量指数の推移(国・地域別)
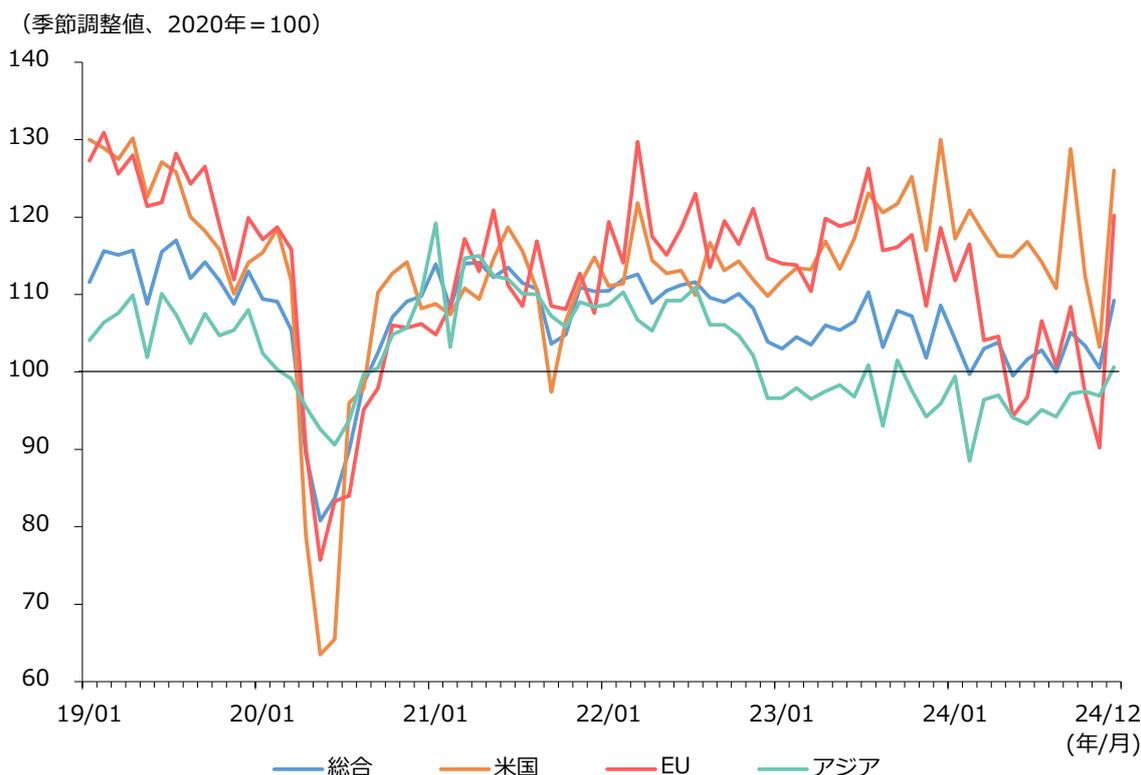
(季節調整値、2020年=100)
The chart displays the output quantity index from January 2019 to December 2024. The y-axis represents the index value (2020=100), ranging from 60 to 140. The x-axis shows dates from 19/01 to 24/12. Four lines are plotted: Total (blue), USA (orange), EU (red), and Asia (green). All lines show a sharp decline in early 2020, with the USA (orange) reaching a low of approximately 65. Recovery begins in mid-2020. In 2024, the USA (orange) and EU (red) show significant peaks, reaching approximately 130 and 125 respectively. The Asia (green) line remains relatively stable, fluctuating around 100.
資料:財務省「貿易統計」
(注)1.内閣府による季節調整値。指数値は「2024年12月分」(2025年1月30日公表)による。
2.「EU」については、英国を除く27か国ベース。