第1-1-6図 輸入数量指数の推移(国・地域別)
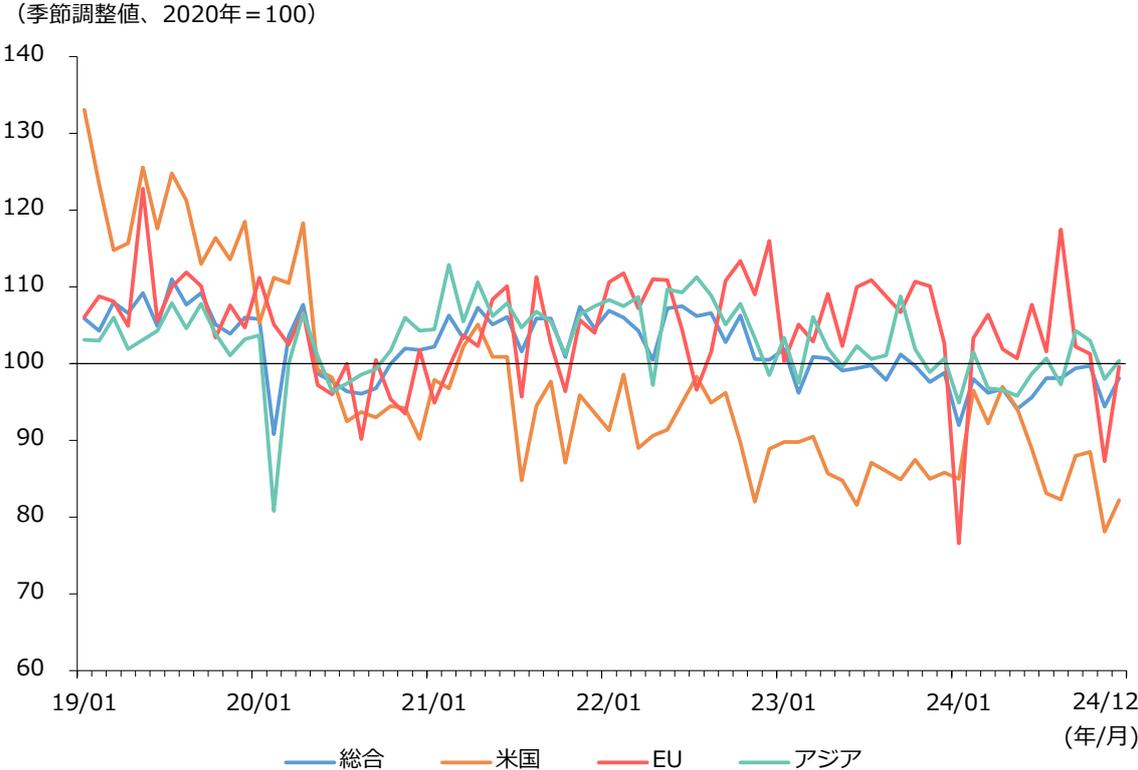
(季節調整値、2020年 = 100)
140
130
120
110
100
90
80
70
60
19/01 20/01 21/01 22/01 23/01 24/01 24/12
(年/月)
— 総合 — 米国 — EU — アジア
Line chart showing the trend of import quantity indices (seasonally adjusted, 2020=100) from January 2019 to December 2024 for four categories: Total (blue), USA (orange), EU (red), and Asia (green). The chart shows significant volatility, with the USA index showing a sharp decline in early 2020 and a long-term downward trend, while the EU and Asia indices remain relatively stable around the 100 baseline.
資料:財務省「貿易統計」
- (注)1.内閣府による季節調整値。指数値は「2024年12月分」(2025年1月30日公表)による。
- 2.「EU」については、英国を除く27か国ベース。
第1節
第2節
第3節
第4節
第5節
第6節
第7節
第8節
第9節