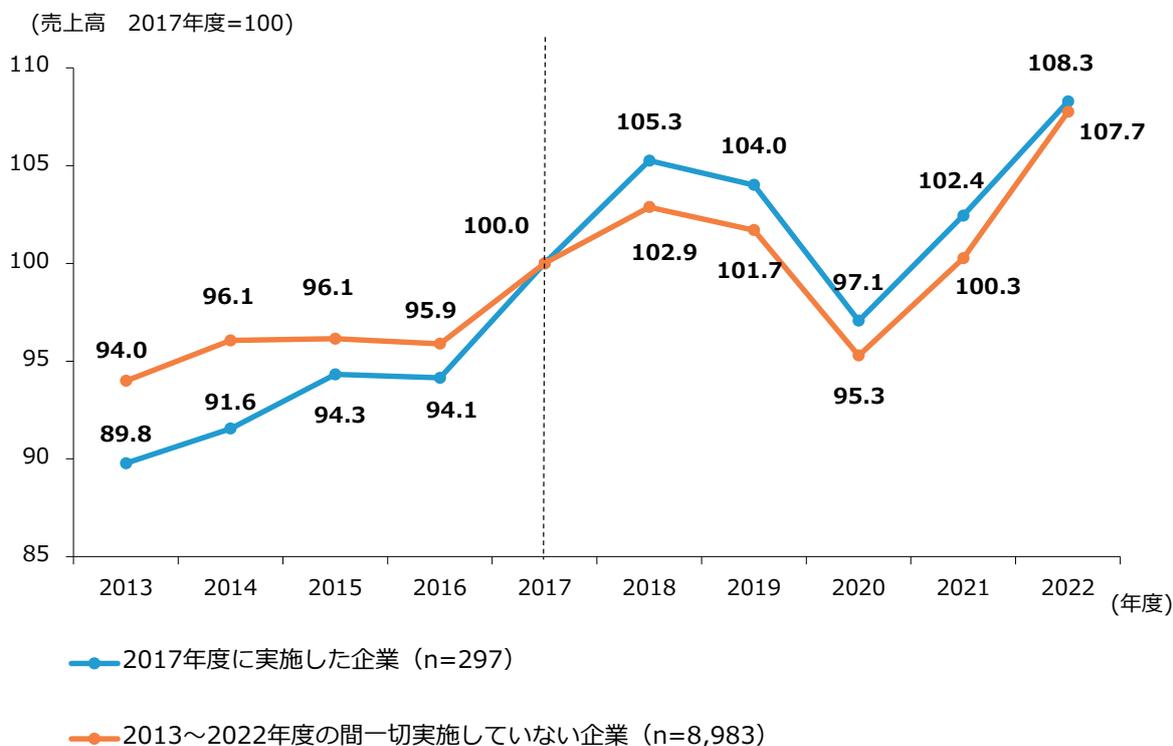
第2-2-51図は、2017年度におけるM&Aの実施有無別に売上高の推移を見たものである。これを見ると、「2017年度に実施した企業」は、
「2013~2022年度の間に一切実施していない企業」よりも、M&Aの実施後において売上高をより高めていることが分かる。
第2-2-51図 売上高の推移(M&Aの実施有無別)
| 年度 | 2017年度に実施した企業 (n=297) | 2013~2022年度の間に一切実施していない企業 (n=8,983) |
|---|---|---|
| 2013 | 89.8 | 94.0 |
| 2014 | 91.6 | 96.1 |
| 2015 | 94.3 | 96.1 |
| 2016 | 94.1 | 95.9 |
| 2017 | 100.0 | 100.0 |
| 2018 | 105.3 | 102.9 |
| 2019 | 104.0 | 101.7 |
| 2020 | 97.1 | 95.3 |
| 2021 | 102.4 | 100.3 |
| 2022 | 108.3 | 107.7 |
Line graph showing sales trends from 2013 to 2022 for two groups of companies: those that implemented M&A in 2017 (blue line) and those that did not implement M&A at all between 2013 and 2022 (orange line). The y-axis represents sales index (2017=100) and the x-axis represents years. The blue line shows a more significant increase in sales after 2017 compared to the orange line.
資料:経済産業省「企業活動基本調査」再編加工
(注)1.パネルデータを基に算出している。パネルデータの詳細は、第2部第2章第2節冒頭の脚注を参照。
2.ここでいうM&Aの実施とは、「事業譲受」、「吸収合併」を実施した場合、及び「国内子会社」若しくは「海外子会社」を1社以上買収した場合をいう。
3.2017年度の数値を100として、2013年度から2022年度までの変化を見たもの。