第2-2-52図は、2017年度のスケール別にM&A実施企業の売上高の推移を見たものである。これを見ると、2022年度時点において、「30億円以上~60億円未満」が最も売上高を高めており、次いで、「30億円未満」、「100億円以上」、「60億円以上~100億円未満」と続いていること
が分かる。研究会においても、売上高30億円~50億円の規模においては、M&Aによりマーケットの限界を打破し、同時に人材確保につなげることが成長に向けて有効であると指摘しており、スケールアップに向けてM&Aの実施には一定の有効性があると示唆される。
第2-2-52図 M&A実施企業の売上高の推移(スケール別)
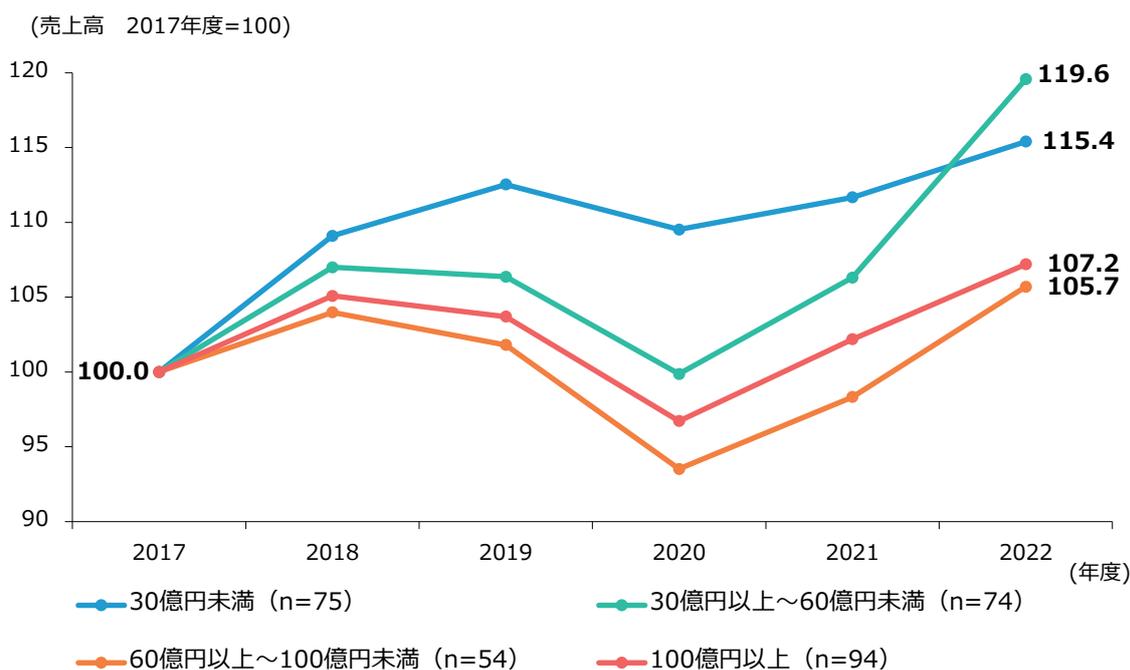
(売上高 2017年度=100)
| 年度 | 30億円未満 (n=75) | 30億円以上~60億円未満 (n=74) | 60億円以上~100億円未満 (n=54) | 100億円以上 (n=94) |
|---|---|---|---|---|
| 2017 | 100.0 | 100.0 | 100.0 | 100.0 |
| 2018 | 109.0 | 107.0 | 104.0 | 105.0 |
| 2019 | 112.0 | 106.0 | 102.0 | 104.0 |
| 2020 | 109.0 | 99.0 | 93.0 | 96.0 |
| 2021 | 111.0 | 106.0 | 98.0 | 102.0 |
| 2022 | 115.4 | 119.6 | 105.7 | 107.2 |
Line graph showing the sales index of M&A-implemented companies from 2017 to 2022, categorized by scale. The y-axis represents the sales index (2017=100) from 90 to 120. The x-axis represents the years from 2017 to 2022. Four lines represent different scales: 30億円未満 (n=75), 30億円以上~60億円未満 (n=74), 60億円以上~100億円未満 (n=54), and 100億円以上 (n=94). All lines start at 100.0 in 2017. The 30億円以上~60億円未満 scale shows the highest growth, reaching 119.6 in 2022. The 30億円未満 scale follows with 115.4. The 100億円以上 and 60億円以上~100億円未満 scales show lower growth, ending at 107.2 and 105.7 respectively in 2022.
資料:経済産業省「企業活動基本調査」再編加工
(注) 1.パネルデータを基に算出している。パネルデータの詳細は、第2部第2章第2節冒頭の脚注を参照。
2.ここでいうM&Aの実施とは、2017年度において、「事業譲受」、「吸収合併」を実施した場合、及び「国内子会社」若しくは「海外子会社」を1社以上買収した場合をいう。
3.2017年度の数値を100として、2017年度から2022年度までの変化を見たもの。
4.スケールは、2017年度の実績である。