第1-1-36図は、前年度の同時期と比較した中小企業の設備投資計画を見たものである。2024
年度の前年度比水準は2023年度のそれと比べて低いことが分かる。
第1-1-36図 中小企業の設備投資計画
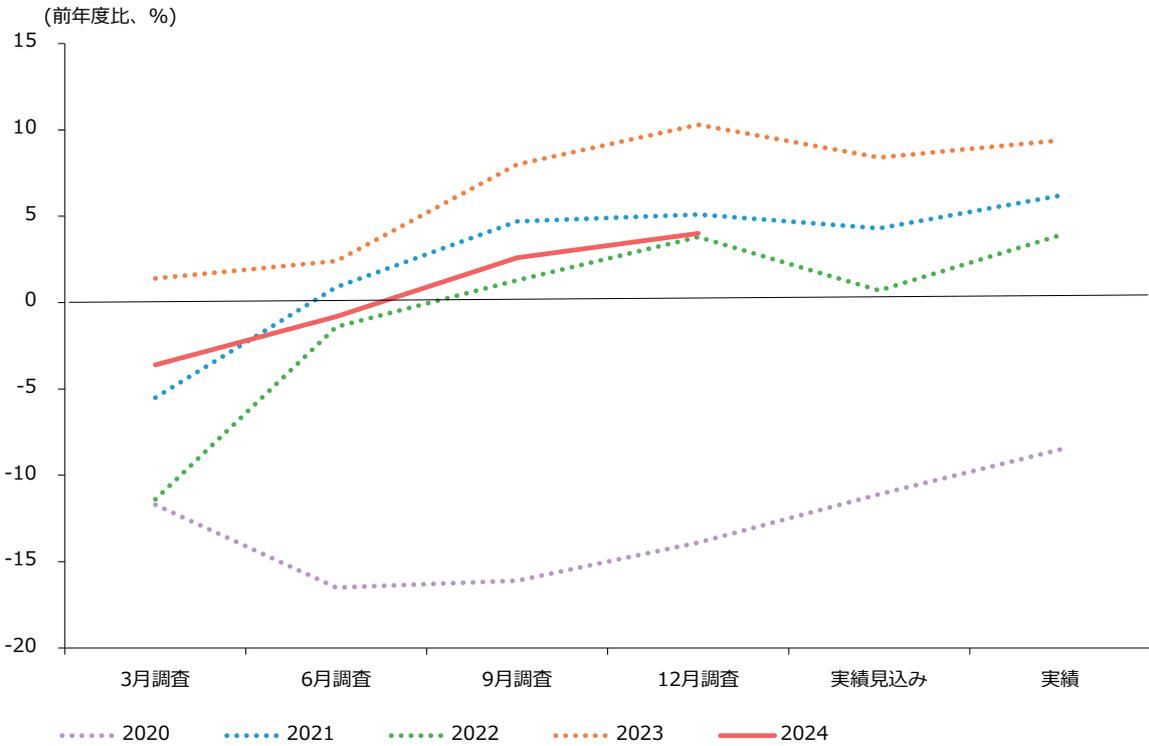
| 調査時期 | 2020 (%) | 2021 (%) | 2022 (%) | 2023 (%) | 2024 (%) |
|---|---|---|---|---|---|
| 3月調査 | -12 | -6 | -12 | 1 | -4 |
| 6月調査 | -17 | 0 | -2 | 2 | -1 |
| 9月調査 | -16 | 4 | 1 | 8 | 3 |
| 12月調査 | -14 | 5 | 4 | 10 | 4 |
| 実績見込み | -11 | 4 | 0 | 8 | - |
| 実績 | -9 | 6 | 4 | 9 | - |
Line chart showing the percentage change in equipment investment plans for SMEs from March 2020 to March 2024. The Y-axis represents the percentage change compared to the previous year, ranging from -20% to 15%. The X-axis shows survey periods: March, June, September, and December surveys, plus actual results and forecasts. Data series are shown for 2020 (purple dotted), 2021 (blue dotted), 2022 (green dotted), 2023 (orange dotted), and 2024 (red solid).
資料:日本銀行「全国企業短期経済観測調査」
(注) ここでの中小企業とは資本金2千万円以上1億円未満の企業とする。
第1節 第2節 第3節 第4節 第5節 第6節 第7節 第8節 第9節