第2-2-23図 経営判断において、重視する利害関係者(スケール別)
(1) 株主
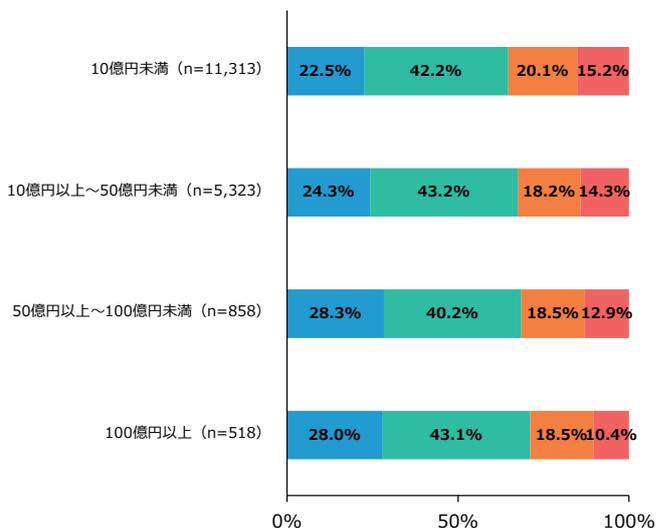
| スケール | 強く重視する | ある程度重視する | あまり重視しない | ほとんど重視しない |
|---|---|---|---|---|
| 10億円未満 (n=11,313) | 22.5% | 42.2% | 20.1% | 15.2% |
| 10億円以上~50億円未満 (n=5,323) | 24.3% | 43.2% | 18.2% | 14.3% |
| 50億円以上~100億円未満 (n=858) | 28.3% | 40.2% | 18.5% | 12.9% |
| 100億円以上 (n=518) | 28.0% | 43.1% | 18.5% | 10.4% |
Stacked bar chart showing the importance of shareholders for different company sizes. The x-axis represents the percentage from 0% to 100%. The y-axis shows company size categories: 10億円未満 (n=11,313), 10億円以上~50億円未満 (n=5,323), 50億円以上~100億円未満 (n=858), and 100億円以上 (n=518). The legend indicates four levels of importance: 強く重視する (blue), ある程度重視する (teal), あまり重視しない (orange), and ほとんど重視しない (red).
(2) 従業員
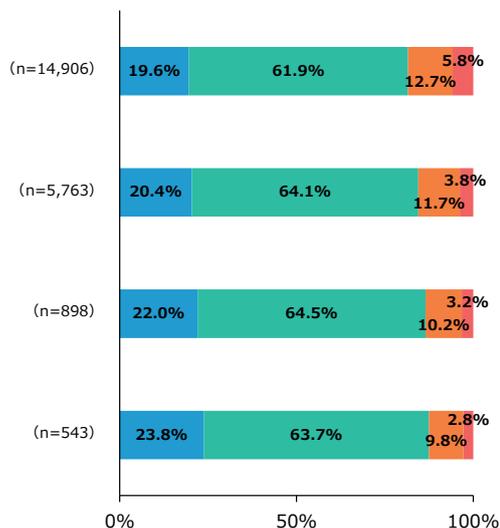
| スケール | 強く重視する | ある程度重視する | あまり重視しない | ほとんど重視しない |
|---|---|---|---|---|
| 10億円未満 (n=14,906) | 19.6% | 61.9% | 12.7% | 5.8% |
| 10億円以上~50億円未満 (n=5,763) | 20.4% | 64.1% | 11.7% | 3.8% |
| 50億円以上~100億円未満 (n=898) | 22.0% | 64.5% | 10.2% | 3.2% |
| 100億円以上 (n=543) | 23.8% | 63.7% | 9.8% | 2.8% |
Stacked bar chart showing the importance of employees for different company sizes. The x-axis represents the percentage from 0% to 100%. The y-axis shows company size categories: 10億円未満 (n=14,906), 10億円以上~50億円未満 (n=5,763), 50億円以上~100億円未満 (n=898), and 100億円以上 (n=543). The legend indicates four levels of importance: 強く重視する (blue), ある程度重視する (teal), あまり重視しない (orange), and ほとんど重視しない (red).
(3) 取引先
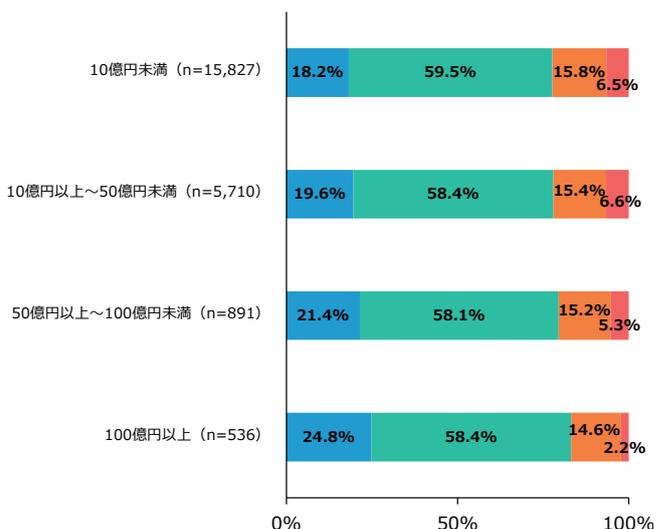
| スケール | 強く重視する | ある程度重視する | あまり重視しない | ほとんど重視しない |
|---|---|---|---|---|
| 10億円未満 (n=15,827) | 18.2% | 59.5% | 15.8% | 6.5% |
| 10億円以上~50億円未満 (n=5,710) | 19.6% | 58.4% | 15.4% | 6.6% |
| 50億円以上~100億円未満 (n=891) | 21.4% | 58.1% | 15.2% | 5.3% |
| 100億円以上 (n=536) | 24.8% | 58.4% | 14.6% | 2.2% |
Stacked bar chart showing the importance of trading partners for different company sizes. The x-axis represents the percentage from 0% to 100%. The y-axis shows company size categories: 10億円未満 (n=15,827), 10億円以上~50億円未満 (n=5,710), 50億円以上~100億円未満 (n=891), and 100億円以上 (n=536). The legend indicates four levels of importance: 強く重視する (blue), ある程度重視する (teal), あまり重視しない (orange), and ほとんど重視しない (red).
(4) 地域社会・地元住民
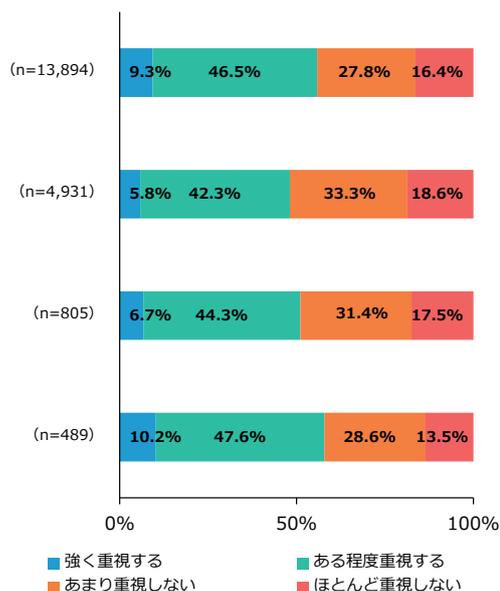
| スケール | 強く重視する | ある程度重視する | あまり重視しない | ほとんど重視しない |
|---|---|---|---|---|
| 10億円未満 (n=13,894) | 9.3% | 46.5% | 27.8% | 16.4% |
| 10億円以上~50億円未満 (n=4,931) | 5.8% | 42.3% | 33.3% | 18.6% |
| 50億円以上~100億円未満 (n=805) | 6.7% | 44.3% | 31.4% | 17.5% |
| 100億円以上 (n=489) | 10.2% | 47.6% | 28.6% | 13.5% |
Stacked bar chart showing the importance of the local community for different company sizes. The x-axis represents the percentage from 0% to 100%. The y-axis shows company size categories: 10億円未満 (n=13,894), 10億円以上~50億円未満 (n=4,931), 50億円以上~100億円未満 (n=805), and 100億円以上 (n=489). The legend indicates four levels of importance: 強く重視する (blue), ある程度重視する (teal), あまり重視しない (orange), and ほとんど重視しない (red).
資料:(株)帝国データバンク「令和6年度中小企業の経営課題と事業活動に関する調査」
(注)1.ここでスケールは、直近(1期前)の売上高に基づいて集計しており、1期前において「事業を開始していない」と回答した事業者は集計から除いている。
2.経営判断を行う際、利害関係者の意見について、どの程度重視しているかを聞いたもの。
3.ここで「取引先」とは、販売先、仕入先、取引金融機関などを指す。
4.利害関係者について、「関係者はいない」と回答した事業者は除いている。